


在 Kubernetes 社区中,PLEG is not healthy 成名已久,只要出现这个报错,就有很大概率造成 Node 状态变成 NotReady。社区相关的 issue 也有一大把,先列几个给你们看看:
- https://stackoverflow.com/questions/53872739/how-to-fix-container-runtime-is-down-pleg-is-not-healthy
- https://github.com/kubernetes/kubernetes/issues/45419
- https://github.com/kubernetes/kubernetes/issues/61117
- https://github.com/kubernetes/kubernetes/issues/72533
- https://github.com/Azure/AKS/issues/102
本文我将尝试解释 PLEG 的工作原理,只要理解了工作原理,再遇到类似的问题就有排查思路了。
PLEG 是个啥?#
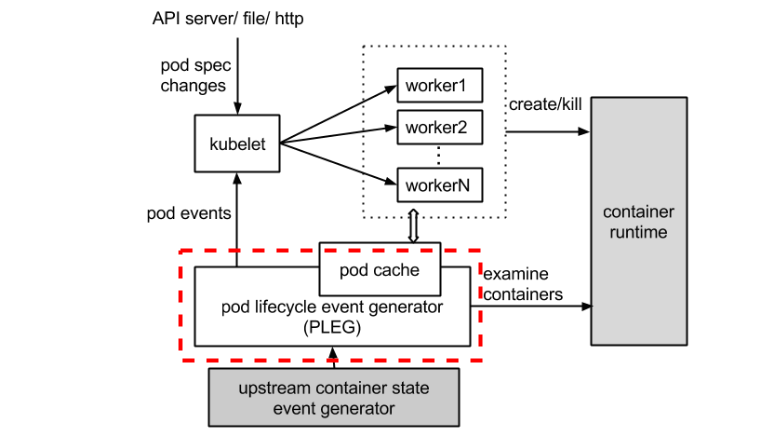
PLEG 全称叫 Pod Lifecycle Event Generator,即 Pod 生命周期事件生成器。实际上它只是 Kubelet 中的一个模块,主要职责就是通过每个匹配的 Pod 级别事件来调整容器运行时的状态,并将调整的结果写入缓存,使 Pod 的缓存保持最新状态。先来聊聊 PLEG 的出现背景。
在 Kubernetes 中,每个节点上都运行着一个守护进程 Kubelet 来管理节点上的容器,调整容器的实际状态以匹配 spec 中定义的状态。具体来说,Kubelet 需要对两个地方的更改做出及时的回应:
- Pod spec 中定义的状态
- 容器运行时的状态
对于 Pod,Kubelet 会从多个数据来源 watch Pod spec 中的变化。对于容器,Kubelet 会定期(例如,10s)轮询容器运行时,以获取所有容器的最新状态。
随着 Pod 和容器数量的增加,轮询会产生不可忽略的开销,并且会由于 Kubelet 的并行操作而加剧这种开销(为每个 Pod 分配一个 goruntine,用来获取容器的状态)。轮询带来的周期性大量并发请求会导致较高的 CPU 使用率峰值(即使 Pod 的定义和容器的状态没有发生改变),降低性能。最后容器运行时可能不堪重负,从而降低系统的可靠性,限制 Kubelet 的可扩展性。
为了降低 Pod 的管理开销,提升 Kubelet 的性能和可扩展性,引入了 PLEG,改进了之前的工作方式:
- 减少空闲期间的不必要工作(例如 Pod 的定义和容器的状态没有发生更改)。
- 减少获取容器状态的并发请求数量。
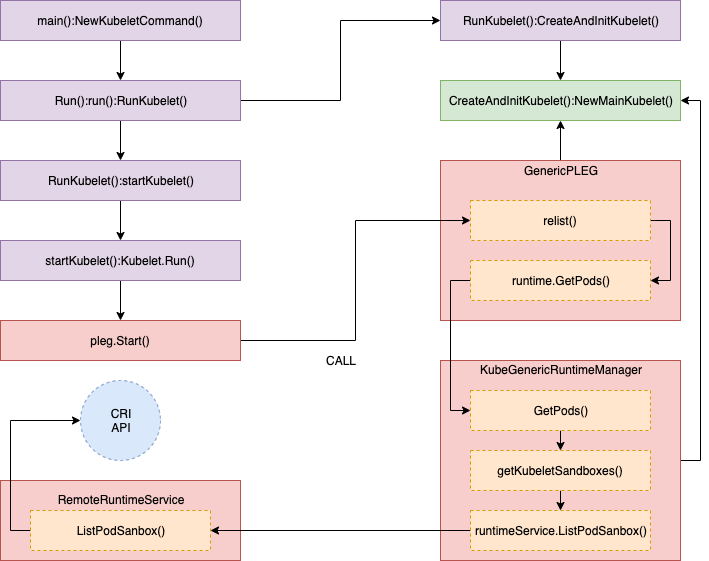
整体的工作流程如下图所示,虚线部分是 PLEG 的工作内容。
PLEG is not healthy 是如何发生的?#
Healthy() 函数会以 “PLEG” 的形式添加到 runtimeState 中,Kubelet 在一个同步循环(SyncLoop() 函数)中会定期(默认是 10s)调用 Healthy() 函数。Healthy() 函数会检查 relist 进程(PLEG 的关键任务)是否在 3 分钟内完成。如果 relist 进程的完成时间超过了 3 分钟,就会报告 PLEG is not healthy。
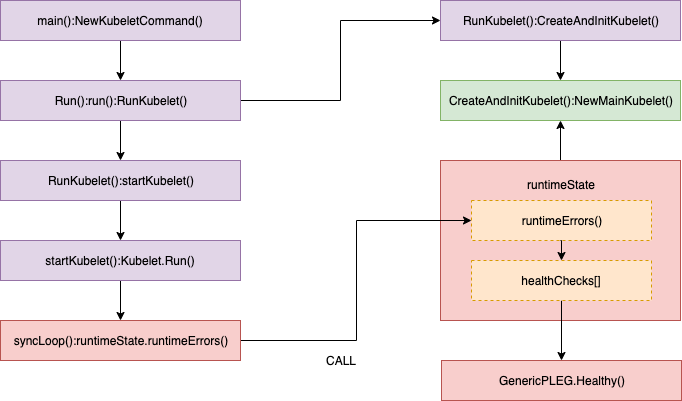
我会在流程的每一步通过源代码解释其相关的工作原理,源代码基于 Kubernetes 1.11(Openshift 3.11)。如果你不熟悉 Go 的语法也不用担心,只需要看代码中的注释就能明白其原理。我也会在放出代码之前先解读一番,并从源代码中裁剪掉不太重要的内容以提高代码的可读性。下面是调用 healthy() 函数的相关代码:
//// pkg/kubelet/pleg/generic.go - Healthy()

// The threshold needs to be greater than the relisting period + the
// relisting time, which can vary significantly. Set a conservative
// threshold to avoid flipping between healthy and unhealthy.
relistThreshold = 3 * time.Minute
:
func (g *GenericPLEG) Healthy() (bool, error) {
  relistTime := g.getRelistTime()
  elapsed := g.clock.Since(relistTime)
  if elapsed > relistThreshold {
    return false, fmt.Errorf("pleg was last seen active %v ago; threshold is %v", elapsed, relistThreshold)
  }
  return true, nil
}

//// pkg/kubelet/kubelet.go - NewMainKubelet()
func NewMainKubelet(kubeCfg *kubeletconfiginternal.KubeletConfiguration, ...
:
  klet.runtimeState.addHealthCheck("PLEG", klet.pleg.Healthy)

//// pkg/kubelet/kubelet.go - syncLoop()
func (kl *Kubelet) syncLoop(updates <-chan kubetypes.PodUpdate, handler SyncHandler) {
:
// The resyncTicker wakes up kubelet to checks if there are any pod workers
// that need to be sync'd. A one-second period is sufficient because the
// sync interval is defaulted to 10s.
:
  const (
    base   = 100 * time.Millisecond
    max    = 5 * time.Second
    factor = 2
  )
  duration := base
  for {
      if rs := kl.runtimeState.runtimeErrors(); len(rs) != 0 {
          glog.Infof("skipping pod synchronization - %v", rs)
          // exponential backoff
          time.Sleep(duration)
          duration = time.Duration(math.Min(float64(max), factor*float64(duration)))
          continue
      }
    :
  }
:
}

//// pkg/kubelet/runtime.go - runtimeErrors()
func (s *runtimeState) runtimeErrors() []string {
:
    for _, hc := range s.healthChecks {
        if ok, err := hc.fn(); !ok {
            ret = append(ret, fmt.Sprintf("%s is not healthy: %v", hc.name, err))
        }
    }
:
}
深入解读 relist 函数#
上文提到 healthy() 函数会检查 relist 的完成时间,但 relist 究竟是用来干嘛的呢?解释 relist 之前,要先解释一下 Pod 的生命周期事件。Pod 的生命周期事件是在 Pod 层面上对底层容器状态改变的抽象,使其与底层的容器运行时无关,这样就可以让 Kubelet 不受底层容器运行时的影响。
type PodLifeCycleEventType string

const (
    ContainerStarted      PodLifeCycleEventType = "ContainerStarted"
    ContainerStopped      PodLifeCycleEventType = "ContainerStopped"
    NetworkSetupCompleted PodLifeCycleEventType = "NetworkSetupCompleted"
    NetworkFailed         PodLifeCycleEventType = "NetworkFailed"
)

// PodLifecycleEvent is an event reflects the change of the pod state.
type PodLifecycleEvent struct {
    // The pod ID.
    ID types.UID
    // The type of the event.
    Type PodLifeCycleEventType
    // The accompanied data which varies based on the event type.
    Data interface{}
}
以 Docker 为例,在 Pod 中启动一个 infra 容器就会在 Kubelet 中注册一个 NetworkSetupCompleted Pod 生命周期事件。
那么 PLEG 是如何知道新启动了一个 infra 容器呢?它会定期重新列出节点上的所有容器(例如 docker ps),并与上一次的容器列表进行对比,以此来判断容器状态的变化。其实这就是 relist() 函数干的事情,尽管这种方法和以前的 Kubelet 轮询类似,但现在只有一个线程,就是 PLEG。现在不需要所有的线程并发获取容器的状态,只有相关的线程会被唤醒用来同步容器状态。而且 relist 与容器运行时无关,也不需要外部依赖,简直完美。
下面我们来看一下 relist() 函数的内部实现。完整的流程如下图所示:
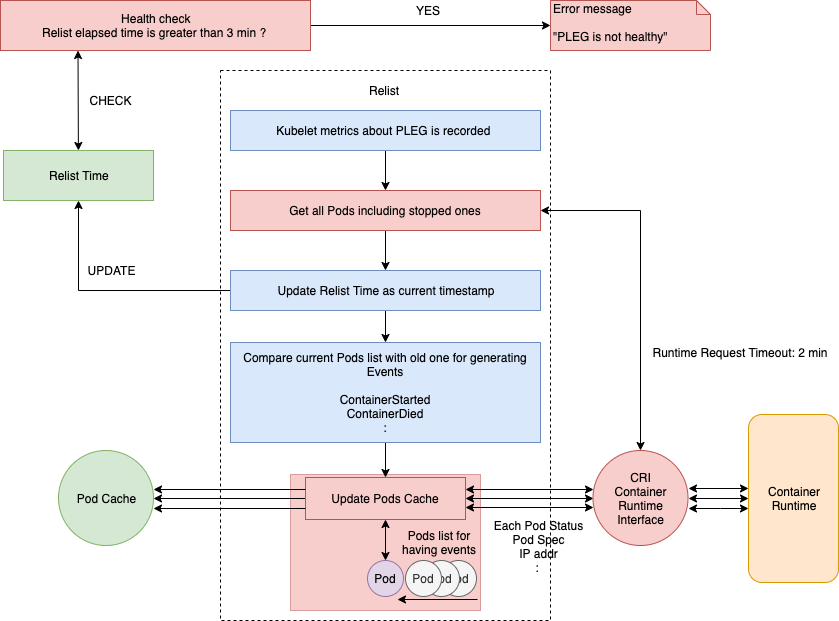
注意图中的 RPC 调用部分,后文将会拎出来详细解读。完整的源代码在 这里。
尽管每秒钟调用一次 relist,但它的完成时间仍然有可能超过 1s。因为下一次调用 relist 必须得等上一次 relist 执行结束,设想一下,如果容器运行时响应缓慢,或者一个周期内有大量的容器状态发生改变,那么 relist 的完成时间将不可忽略,假设是 5s,那么下一次调用 relist 将要等到 6s 之后。
相关的源代码如下:
//// pkg/kubelet/kubelet.go - NewMainKubelet()
// Generic PLEG relies on relisting for discovering container events.
// A longer period means that kubelet will take longer to detect container
// changes and to update pod status. On the other hand, a shorter period
// will cause more frequent relisting (e.g., container runtime operations),
// leading to higher cpu usage.
// Note that even though we set the period to 1s, the relisting itself can
// take more than 1s to finish if the container runtime responds slowly
// and/or when there are many container changes in one cycle.
plegRelistPeriod = time.Second * 1
// NewMainKubelet instantiates a new Kubelet object along with all the required internal modules.
// No initialization of Kubelet and its modules should happen here.
func NewMainKubelet(kubeCfg *kubeletconfiginternal.KubeletConfiguration, ...
:
klet.pleg = pleg.NewGenericPLEG(klet.containerRuntime, plegChannelCapacity, plegRelistPeriod, klet.podCache, clock.RealClock{})
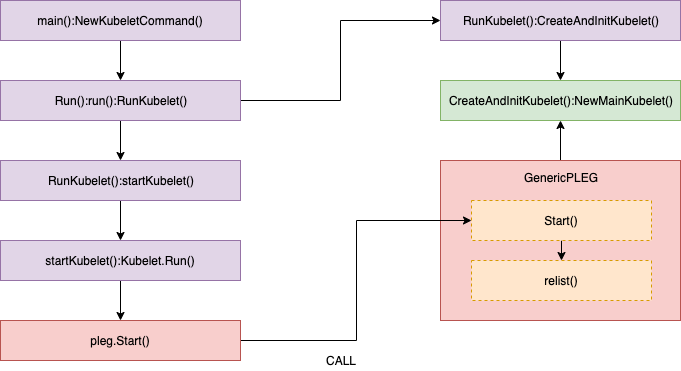
//// pkg/kubelet/pleg/generic.go - Start()
// Start spawns a goroutine to relist periodically.
func (g *GenericPLEG) Start() {
go wait.Until(g.relist, g.relistPeriod, wait.NeverStop)
}
//// pkg/kubelet/pleg/generic.go - relist()
func (g *GenericPLEG) relist() {
... WE WILL REVIEW HERE ...
}
回到上面那幅图,relist 函数第一步就是记录 Kubelet 的相关指标(例如 kubelet_pleg_relist_latency_microseconds),然后通过 CRI 从容器运行时获取当前的 Pod 列表(包括停止的 Pod)。该 Pod 列表会和之前的 Pod 列表进行比较,检查哪些状态发生了变化,然后同时生成相关的 Pod 生命周期事件和更改后的状态。
//// pkg/kubelet/pleg/generic.go - relist()
  :
  // get a current timestamp
  timestamp := g.clock.Now()

  // kubelet_pleg_relist_latency_microseconds for prometheus metrics
    defer func() {
        metrics.PLEGRelistLatency.Observe(metrics.SinceInMicroseconds(timestamp))
    }()

  // Get all the pods.
    podList, err := g.runtime.GetPods(true)
  :
其中 GetPods() 函数的调用堆栈如下图所示:
相关的源代码如下:
//// pkg/kubelet/kuberuntime/kuberuntime_manager.go - GetPods()

// GetPods returns a list of containers grouped by pods. The boolean parameter
// specifies whether the runtime returns all containers including those already
// exited and dead containers (used for garbage collection).
func (m *kubeGenericRuntimeManager) GetPods(all bool) ([]*kubecontainer.Pod, error) {
    pods := make(map[kubetypes.UID]*kubecontainer.Pod)
    sandboxes, err := m.getKubeletSandboxes(all)
:
}

//// pkg/kubelet/kuberuntime/kuberuntime_sandbox.go - getKubeletSandboxes()

// getKubeletSandboxes lists all (or just the running) sandboxes managed by kubelet.
func (m *kubeGenericRuntimeManager) getKubeletSandboxes(all bool) ([]*runtimeapi.PodSandbox, error) {
:
    resp, err := m.runtimeService.ListPodSandbox(filter)
:
}

//// pkg/kubelet/remote/remote_runtime.go - ListPodSandbox()

// ListPodSandbox returns a list of PodSandboxes.
func (r *RemoteRuntimeService) ListPodSandbox(filter *runtimeapi.PodSandboxFilter) ([]*runtimeapi.PodSandbox, error) {
:
    resp, err := r.runtimeClient.ListPodSandbox(ctx, &runtimeapi.ListPodSandboxRequest{
:
    return resp.Items, nil
}
获取所有的 Pod 列表后,relist 的完成时间就会更新成当前的时间戳。也就是说,Healthy() 函数可以根据这个时间戳来评估 relist 是否超过了 3 分钟。
//// pkg/kubelet/pleg/generic.go - relist()

  // update as a current timestamp
  g.updateRelistTime(timestamp)
将当前的 Pod 列表和上一次 relist 的 Pod 列表进行对比之后,就会针对每一个变化生成相应的 Pod 级别的事件。相关的源代码如下:
//// pkg/kubelet/pleg/generic.go - relist()

  pods := kubecontainer.Pods(podList)
  g.podRecords.setCurrent(pods)

  // Compare the old and the current pods, and generate events.
  eventsByPodID := map[types.UID][]*PodLifecycleEvent{}
  for pid := range g.podRecords {
    oldPod := g.podRecords.getOld(pid)
    pod := g.podRecords.getCurrent(pid)

    // Get all containers in the old and the new pod.
    allContainers := getContainersFromPods(oldPod, pod)
    for _, container := range allContainers {
          events := computeEvents(oldPod, pod, &container.ID)

          for _, e := range events {
                updateEvents(eventsByPodID, e)
          }
        }
  }
其中 generateEvents() 函数(computeEvents() 函数会调用它)用来生成相应的 Pod 级别的事件(例如 ContainerStarted、ContainerDied 等等),然后通过 updateEvents() 函数来更新事件。
computeEvents() 函数的内容如下:
//// pkg/kubelet/pleg/generic.go - computeEvents()

func computeEvents(oldPod, newPod *kubecontainer.Pod, cid *kubecontainer.ContainerID) []*PodLifecycleEvent {
:
    return generateEvents(pid, cid.ID, oldState, newState)
}

//// pkg/kubelet/pleg/generic.go - generateEvents()

func generateEvents(podID types.UID, cid string, oldState, newState plegContainerState) []*PodLifecycleEvent {
:
    glog.V(4).Infof("GenericPLEG: %v/%v: %v -> %v", podID, cid, oldState, newState)
    switch newState {
    case plegContainerRunning:
      return []*PodLifecycleEvent{{ID: podID, Type: ContainerStarted, Data: cid}}
    case plegContainerExited:
      return []*PodLifecycleEvent{{ID: podID, Type: ContainerDied, Data: cid}}
    case plegContainerUnknown:
      return []*PodLifecycleEvent{{ID: podID, Type: ContainerChanged, Data: cid}}
    case plegContainerNonExistent:
      switch oldState {
      case plegContainerExited:
        // We already reported that the container died before.
        return []*PodLifecycleEvent{{ID: podID, Type: ContainerRemoved, Data: cid}}
      default:
        return []*PodLifecycleEvent{{ID: podID, Type: ContainerDied, Data: cid}, {ID: podID, Type: ContainerRemoved, Data: cid}}
      }
    default:
      panic(fmt.Sprintf("unrecognized container state: %v", newState))
  }
}
relist 的最后一个任务是检查是否有与 Pod 关联的事件,并按照下面的流程更新 podCache。
//// pkg/kubelet/pleg/generic.go - relist()

  // If there are events associated with a pod, we should update the
  // podCache.
  for pid, events := range eventsByPodID {
    pod := g.podRecords.getCurrent(pid)
    if g.cacheEnabled() {
      // updateCache() will inspect the pod and update the cache. If an
      // error occurs during the inspection, we want PLEG to retry again
      // in the next relist. To achieve this, we do not update the
      // associated podRecord of the pod, so that the change will be
      // detect again in the next relist.
      // TODO: If many pods changed during the same relist period,
      // inspecting the pod and getting the PodStatus to update the cache
      // serially may take a while. We should be aware of this and
      // parallelize if needed.
      if err := g.updateCache(pod, pid); err != nil {
        glog.Errorf("PLEG: Ignoring events for pod %s/%s: %v", pod.Name, pod.Namespace, err)
        :
      }
      :
    }
    // Update the internal storage and send out the events.
    g.podRecords.update(pid)
    for i := range events {
      // Filter out events that are not reliable and no other components use yet.
      if events[i].Type == ContainerChanged {
           continue
      }
      g.eventChannel <- events[i]
     }
  }
updateCache() 将会检查每个 Pod,并在单个循环中依次对其进行更新。因此,如果在同一个 relist 中更改了大量的 Pod,那么 updateCache 过程将会成为瓶颈。最后,更新后的 Pod 生命周期事件将会被发送到 eventChannel。
某些远程客户端还会调用每一个 Pod 来获取 Pod 的 spec 定义信息,这样一来,Pod 数量越多,延时就可能越高,因为 Pod 越多就会生成越多的事件。
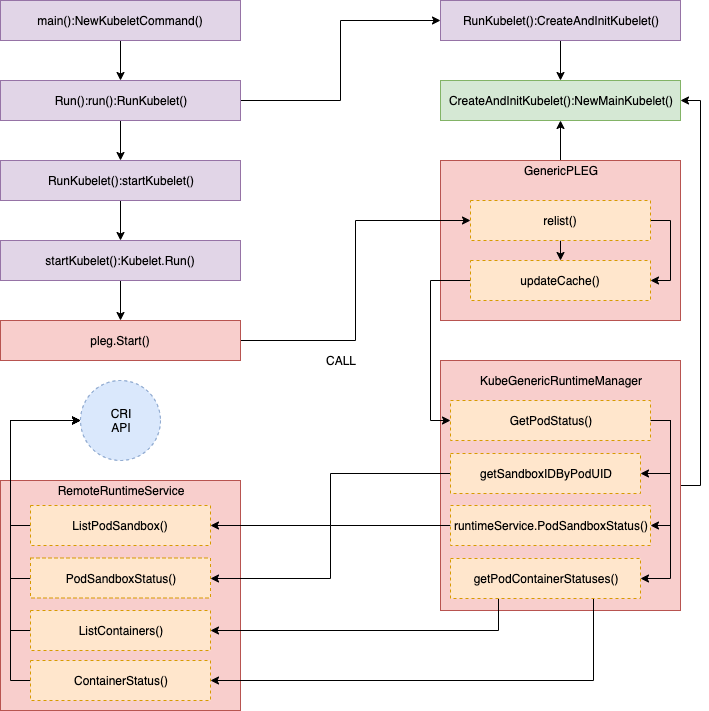
updateCache() 的详细调用堆栈如下图所示,其中 GetPodStatus() 用来获取 Pod 的 spec 定义信息:
完整的代码如下:
//// pkg/kubelet/pleg/generic.go - updateCache()

func (g *GenericPLEG) updateCache(pod *kubecontainer.Pod, pid types.UID) error {
:
    timestamp := g.clock.Now()
    // TODO: Consider adding a new runtime method
    // GetPodStatus(pod *kubecontainer.Pod) so that Docker can avoid listing
    // all containers again.
    status, err := g.runtime.GetPodStatus(pod.ID, pod.Name, pod.Namespace)
  :
    g.cache.Set(pod.ID, status, err, timestamp)
    return err
}

//// pkg/kubelet/kuberuntime/kuberuntime_manager.go - GetPodStatus()

// GetPodStatus retrieves the status of the pod, including the
// information of all containers in the pod that are visible in Runtime.
func (m *kubeGenericRuntimeManager) GetPodStatus(uid kubetypes.UID, name, namespace string) (*kubecontainer.PodStatus, error) {
  podSandboxIDs, err := m.getSandboxIDByPodUID(uid, nil)
  :
    for idx, podSandboxID := range podSandboxIDs {
        podSandboxStatus, err := m.runtimeService.PodSandboxStatus(podSandboxID)
    :
    }

    // Get statuses of all containers visible in the pod.
    containerStatuses, err := m.getPodContainerStatuses(uid, name, namespace)
  :
}

//// pkg/kubelet/kuberuntime/kuberuntime_sandbox.go - getSandboxIDByPodUID()

// getPodSandboxID gets the sandbox id by podUID and returns ([]sandboxID, error).
// Param state could be nil in order to get all sandboxes belonging to same pod.
func (m *kubeGenericRuntimeManager) getSandboxIDByPodUID(podUID kubetypes.UID, state *runtimeapi.PodSandboxState) ([]string, error) {
  :
  sandboxes, err := m.runtimeService.ListPodSandbox(filter)
  :
  return sandboxIDs, nil
}

//// pkg/kubelet/remote/remote_runtime.go - PodSandboxStatus()

// PodSandboxStatus returns the status of the PodSandbox.
func (r *RemoteRuntimeService) PodSandboxStatus(podSandBoxID string) (*runtimeapi.PodSandboxStatus, error) {
    ctx, cancel := getContextWithTimeout(r.timeout)
    defer cancel()

    resp, err := r.runtimeClient.PodSandboxStatus(ctx, &runtimeapi.PodSandboxStatusRequest{
        PodSandboxId: podSandBoxID,
    })
  :
    return resp.Status, nil
}

//// pkg/kubelet/kuberuntime/kuberuntime_container.go - getPodContainerStatuses()

// getPodContainerStatuses gets all containers' statuses for the pod.
func (m *kubeGenericRuntimeManager) getPodContainerStatuses(uid kubetypes.UID, name, namespace string) ([]*kubecontainer.ContainerStatus, error) {
  // Select all containers of the given pod.
  containers, err := m.runtimeService.ListContainers(&runtimeapi.ContainerFilter{
    LabelSelector: map[string]string{types.KubernetesPodUIDLabel: string(uid)},
  })
  :
  // TODO: optimization: set maximum number of containers per container name to examine.
  for i, c := range containers {
    status, err := m.runtimeService.ContainerStatus(c.Id)
    :
  }
  :
  return statuses, nil
}
上面就是 relist() 函数的完整调用堆栈,我在讲解的过程中结合了相关的源代码,希望能为你提供有关 PLEG 的更多细节。为了实时了解 PLEG 的健康状况,最好的办法就是监控 relist。
监控 relist#
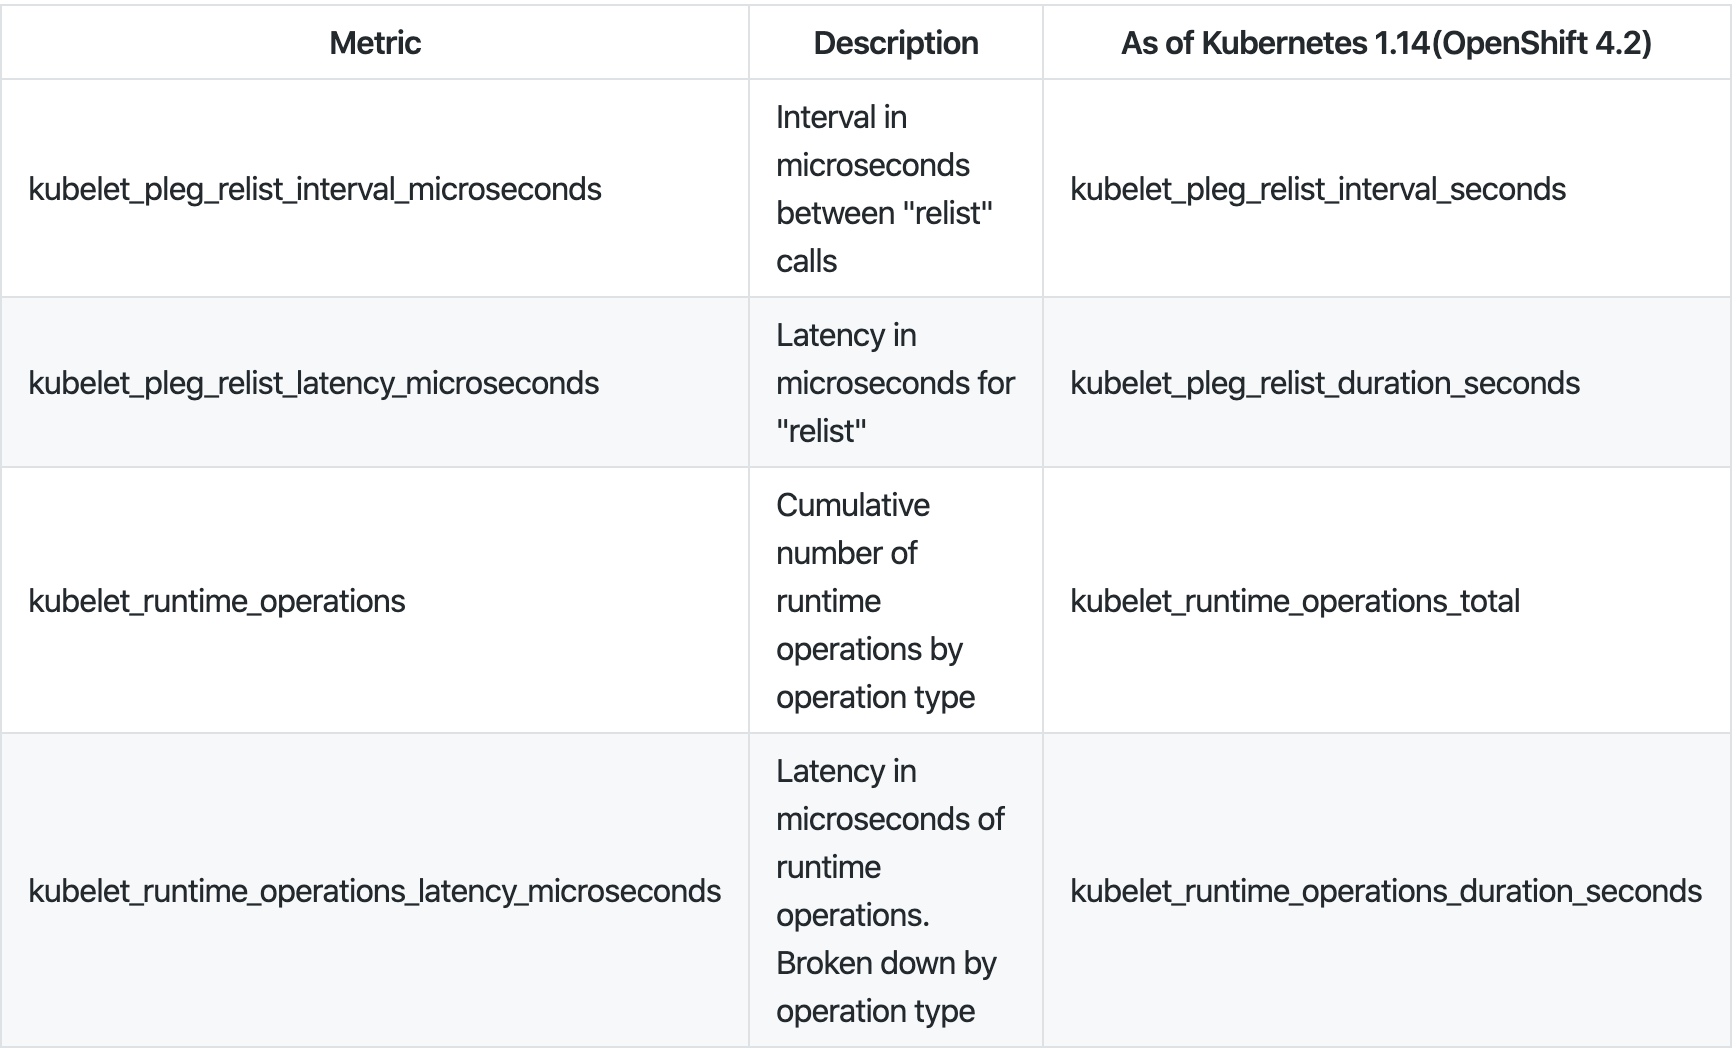
我们可以通过监控 Kubelet 的指标来了解 relist 的延时。relist 的调用周期是 1s,那么 relist 的完成时间 + 1s 就等于 kubelet_pleg_relist_interval_microseconds 指标的值。你也可以监控容器运行时每个操作的延时,这些指标在排查故障时都能提供线索。
你可以在每个节点上通过访问 URL https://127.0.0.1:10250/metrics 来获取 Kubelet 的指标。
# HELP kubelet_pleg_relist_interval_microseconds Interval in microseconds between relisting in PLEG.
# TYPE kubelet_pleg_relist_interval_microseconds summary
kubelet_pleg_relist_interval_microseconds{quantile="0.5"} 1.054052e+06
kubelet_pleg_relist_interval_microseconds{quantile="0.9"} 1.074873e+06
kubelet_pleg_relist_interval_microseconds{quantile="0.99"} 1.126039e+06
kubelet_pleg_relist_interval_microseconds_count 5146

# HELP kubelet_pleg_relist_latency_microseconds Latency in microseconds for relisting pods in PLEG.
# TYPE kubelet_pleg_relist_latency_microseconds summary
kubelet_pleg_relist_latency_microseconds{quantile="0.5"} 53438
kubelet_pleg_relist_latency_microseconds{quantile="0.9"} 74396
kubelet_pleg_relist_latency_microseconds{quantile="0.99"} 115232
kubelet_pleg_relist_latency_microseconds_count 5106

# HELP kubelet_runtime_operations Cumulative number of runtime operations by operation type.
# TYPE kubelet_runtime_operations counter
kubelet_runtime_operations{operation_type="container_status"} 472
kubelet_runtime_operations{operation_type="create_container"} 93
kubelet_runtime_operations{operation_type="exec"} 1
kubelet_runtime_operations{operation_type="exec_sync"} 533
kubelet_runtime_operations{operation_type="image_status"} 579
kubelet_runtime_operations{operation_type="list_containers"} 10249
kubelet_runtime_operations{operation_type="list_images"} 782
kubelet_runtime_operations{operation_type="list_podsandbox"} 10154
kubelet_runtime_operations{operation_type="podsandbox_status"} 315
kubelet_runtime_operations{operation_type="pull_image"} 57
kubelet_runtime_operations{operation_type="remove_container"} 49
kubelet_runtime_operations{operation_type="run_podsandbox"} 28
kubelet_runtime_operations{operation_type="start_container"} 93
kubelet_runtime_operations{operation_type="status"} 1116
kubelet_runtime_operations{operation_type="stop_container"} 9
kubelet_runtime_operations{operation_type="stop_podsandbox"} 33
kubelet_runtime_operations{operation_type="version"} 564

# HELP kubelet_runtime_operations_latency_microseconds Latency in microseconds of runtime operations. Broken down by operation type.
# TYPE kubelet_runtime_operations_latency_microseconds summary
kubelet_runtime_operations_latency_microseconds{operation_type="container_status",quantile="0.5"} 12117
kubelet_runtime_operations_latency_microseconds{operation_type="container_status",quantile="0.9"} 26607
kubelet_runtime_operations_latency_microseconds{operation_type="container_status",quantile="0.99"} 27598
kubelet_runtime_operations_latency_microseconds_count{operation_type="container_status"} 486
kubelet_runtime_operations_latency_microseconds{operation_type="list_containers",quantile="0.5"} 29972
kubelet_runtime_operations_latency_microseconds{operation_type="list_containers",quantile="0.9"} 47907
kubelet_runtime_operations_latency_microseconds{operation_type="list_containers",quantile="0.99"} 80982
kubelet_runtime_operations_latency_microseconds_count{operation_type="list_containers"} 10812
kubelet_runtime_operations_latency_microseconds{operation_type="list_podsandbox",quantile="0.5"} 18053
kubelet_runtime_operations_latency_microseconds{operation_type="list_podsandbox",quantile="0.9"} 28116
kubelet_runtime_operations_latency_microseconds{operation_type="list_podsandbox",quantile="0.99"} 68748
kubelet_runtime_operations_latency_microseconds_count{operation_type="list_podsandbox"} 10712
kubelet_runtime_operations_latency_microseconds{operation_type="podsandbox_status",quantile="0.5"} 4918
kubelet_runtime_operations_latency_microseconds{operation_type="podsandbox_status",quantile="0.9"} 15671
kubelet_runtime_operations_latency_microseconds{operation_type="podsandbox_status",quantile="0.99"} 18398
kubelet_runtime_operations_latency_microseconds_count{operation_type="podsandbox_status"} 323
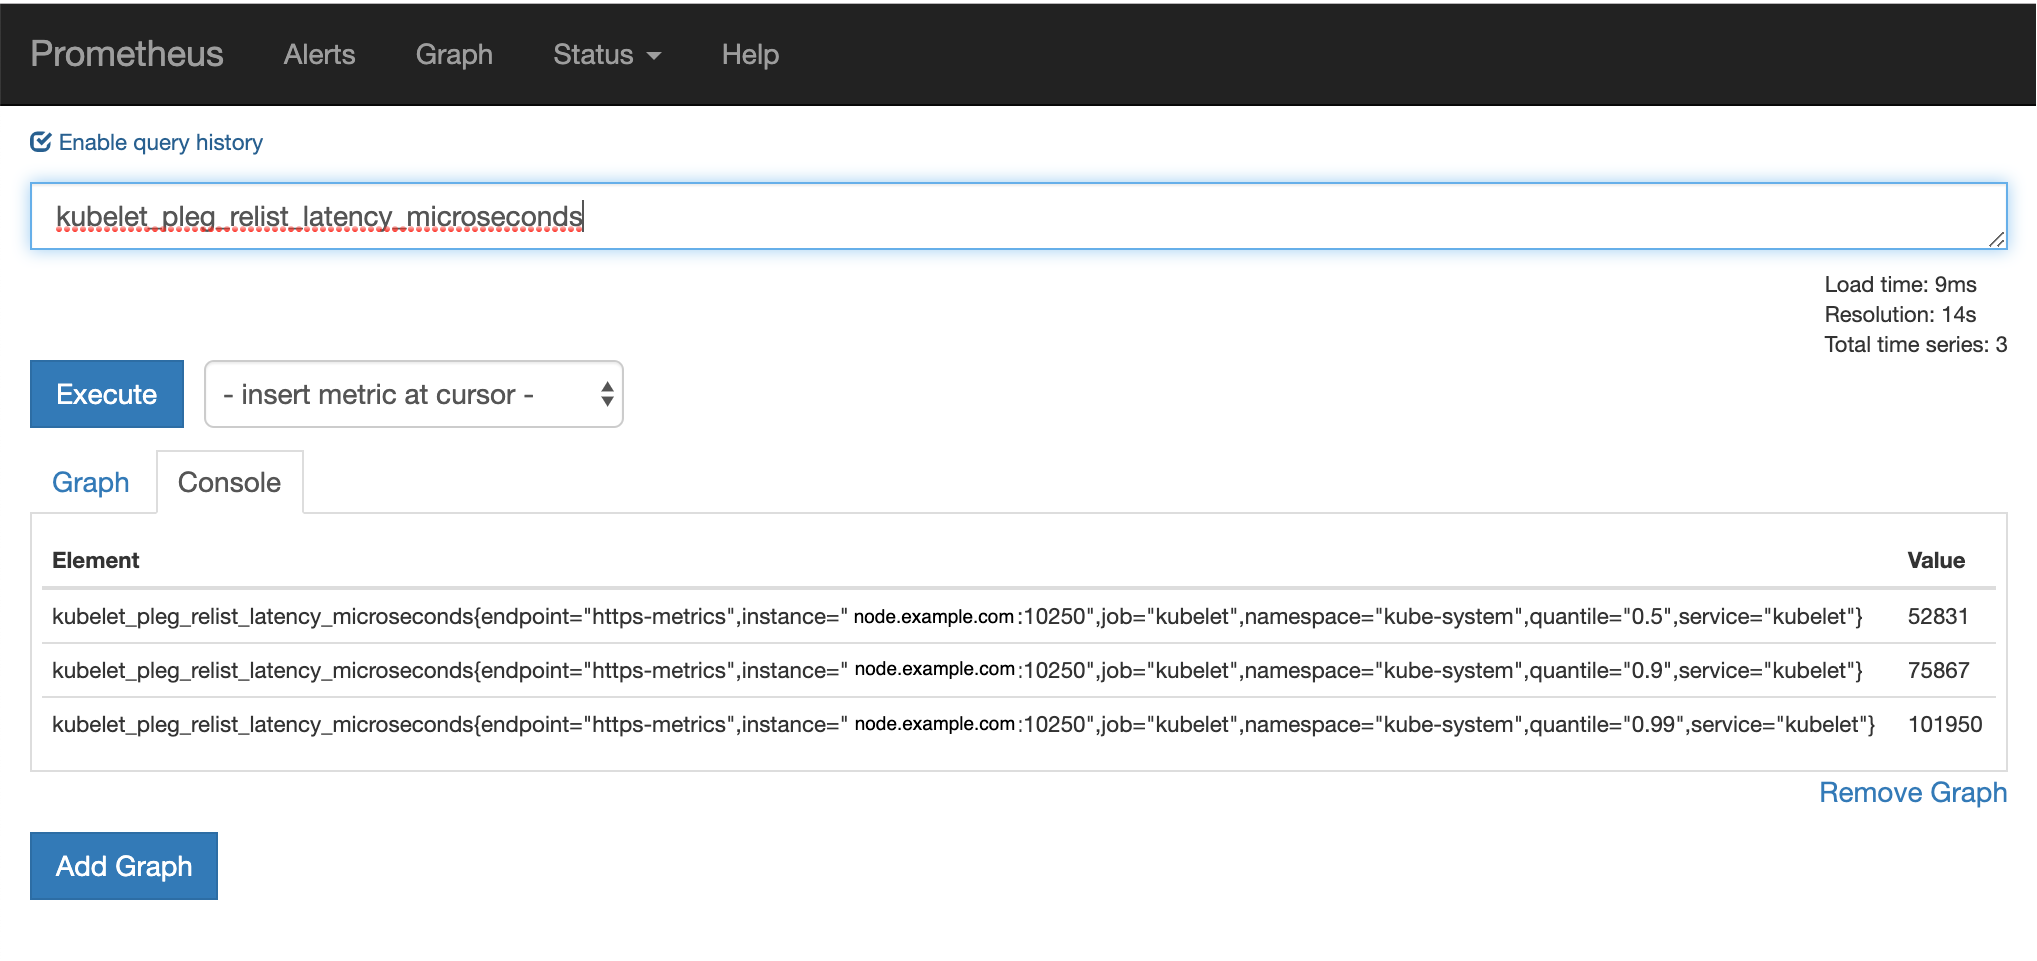
可以通过 Prometheus 对其进行监控:
总结#
以我的经验,造成 PLEG is not healthy 的因素有很多,而且我相信还有更多潜在的因素我们还没有遇到过。我只提供几个我能想到的原因:
- RPC 调用过程中容器运行时响应超时(有可能是性能下降,死锁或者出现了 bug)。
- 节点上的 Pod 数量太多,导致
relist无法在 3 分钟内完成。事件数量和延时与 Pod 数量成正比,与节点资源无关。 - relist 出现了死锁,该 bug 已在 Kubernetes 1.14 中修复。
- 获取 Pod 的网络堆栈信息时 CNI 出现了 bug。