Calico 中最核心的组件就是 Felix,它负责设置路由表和 ACL 规则等,以便为该主机上的 endpoints 资源正常运行提供所需的网络连接。同时它还负责提供有关网络健康状况的数据(例如,报告配置其主机时发生的错误和问题),这些数据会被写入 etcd,以使其对网络中的其他组件和操作人员可见。
由此可见,对于我们的监控来说,监控 Calico 的核心便是监控 Felix,Felix 就相当于 Calico 的大脑。本文将学习如何使用 Prometheus-Operator 来监控 Calico。
Calico 和 Prometheus-Operator 的部署细节,如果不知道如何部署,请查阅官方文档和相关博客。1. 配置 Calico 以启用指标#
默认情况下 Felix 的指标是被禁用的,必须通过命令行管理工具 calicoctl 手动更改 Felix 配置才能开启,需要提前配置好命令行管理工具。
本文使用的 Calico 版本是 v3.15.0,其他版本类似。先下载管理工具:
$ wget https://github.com/projectcalico/calicoctl/releases/download/v3.15.0/calicoctl -O /usr/local/bin/calicoctl
$ chmod +x /usr/local/bin/calicoctl
接下来需要设置 calicoctl 配置文件(默认是 /etc/calico/calicoctl.cfg)。如果你的 Calico 后端存储使用的是 Kubernetes API,那么配置文件内容如下:
apiVersion: projectcalico.org/v3
kind: CalicoAPIConfig
metadata:
spec:
  datastoreType: "kubernetes"
  kubeconfig: "/root/.kube/config"
如果 Calico 后端存储使用的是 etcd,那么配置文件内容如下:
apiVersion: projectcalico.org/v3
kind: CalicoAPIConfig
metadata:
spec:
  datastoreType: "etcdv3"
  etcdEndpoints: https://192.168.57.51:2379,https://192.168.57.52:2379,https://192.168.57.53:2379
  etcdKeyFile: /opt/kubernetes/ssl/server-key.pem
  etcdCertFile: /opt/kubernetes/ssl/server.pem
  etcdCACertFile: /opt/kubernetes/ssl/ca.pem
你需要将其中的证书路径换成你的 etcd 证书路径。
配置好了 calicoctl 之后就可以查看或修改 Calico 的配置了,先来看一下默认的 Felix 配置:
$ calicoctl get felixConfiguration default -o yaml

apiVersion: projectcalico.org/v3
kind: FelixConfiguration
metadata:
  creationTimestamp: "2020-06-25T14:37:28Z"
  name: default
  resourceVersion: "269031"
  uid: 52146c95-ff97-40a9-9ba7-7c3b4dd3ba57
spec:
  bpfLogLevel: ""
  ipipEnabled: true
  logSeverityScreen: Info
  reportingInterval: 0s
可以看到默认的配置中没有启用指标,需要手动修改配置,命令如下:
$ calicoctl patch felixConfiguration default --patch '{"spec":{"prometheusMetricsEnabled": true}}'
Felix 暴露指标的端口是 9091,可通过检查监听端口来验证是否开启指标:
$ ss -tulnp|grep 9091
tcp    LISTEN     0      4096   [::]:9091               [::]:*                   users:(("calico-node",pid=13761,fd=9))

$ curl -s http://localhost:9091/metrics
# HELP felix_active_local_endpoints Number of active endpoints on this host.
# TYPE felix_active_local_endpoints gauge
felix_active_local_endpoints 1
# HELP felix_active_local_policies Number of active policies on this host.
# TYPE felix_active_local_policies gauge
felix_active_local_policies 0
# HELP felix_active_local_selectors Number of active selectors on this host.
# TYPE felix_active_local_selectors gauge
felix_active_local_selectors 0
...
2. Prometheus 采集 Felix 指标#
启用了 Felix 的指标后,就可以通过 Prometheus-Operator 来采集指标数据了。Prometheus-Operator 在部署时会创建 Prometheus、PodMonitor、ServiceMonitor、AlertManager 和 PrometheusRule 这 5 个 CRD 资源对象,然后会一直监控并维持这 5 个资源对象的状态。其中 Prometheus 这个资源对象就是对 Prometheus Server 的抽象。而 PodMonitor 和 ServiceMonitor 就是 exporter 的各种抽象,是用来提供专门提供指标数据接口的工具,Prometheus 就是通过 PodMonitor 和 ServiceMonitor 提供的指标数据接口去 pull 数据的。
ServiceMonitor 要求被监控的服务必须有对应的 Service,而 PodMonitor 则不需要,本文选择使用 PodMonitor 来采集 Felix 的指标。
PodMonitor 虽然不需要应用创建相应的 Service,但必须在 Pod 中指定指标的端口和名称,因此需要先修改 DaemonSet calico-node 的配置,指定端口和名称。先用以下命令打开 DaemonSet calico-node 的配置:
$ kubectl -n kube-system edit ds calico-node
然后在线修改,在 spec.template.sepc.containers 中加入以下内容:
        ports:
        - containerPort: 9091
          name: http-metrics
          protocol: TCP
创建 Pod 对应的 PodMonitor:
# prometheus-podMonitorCalico.yaml
apiVersion: monitoring.coreos.com/v1
kind: PodMonitor
metadata:
  labels:
    k8s-app: calico-node
  name: felix
  namespace: monitoring
spec:
  podMetricsEndpoints:
  - interval: 15s
    path: /metrics
    port: http-metrics
  namespaceSelector:
    matchNames:
    - kube-system
  selector:
    matchLabels:
      k8s-app: calico-node
$ kubectl apply -f prometheus-podMonitorCalico.yaml
有几个参数需要注意:
PodMonitor 的 name 最终会反应到 Prometheus 的配置中,作为
job_name。podMetricsEndpoints.port需要和被监控的 Pod 中的ports.name相同,此处为http-metrics。namespaceSelector.matchNames需要和被监控的 Pod 所在的 namespace 相同,此处为kube-system。selector.matchLabels的标签必须和被监控的 Pod 中能唯一标明身份的标签对应。
最终 Prometheus-Operator 会根据 PodMonitor 来修改 Prometheus 的配置文件,以实现对相关的 Pod 进行监控。可以打开 Prometheus 的 UI 查看监控目标:
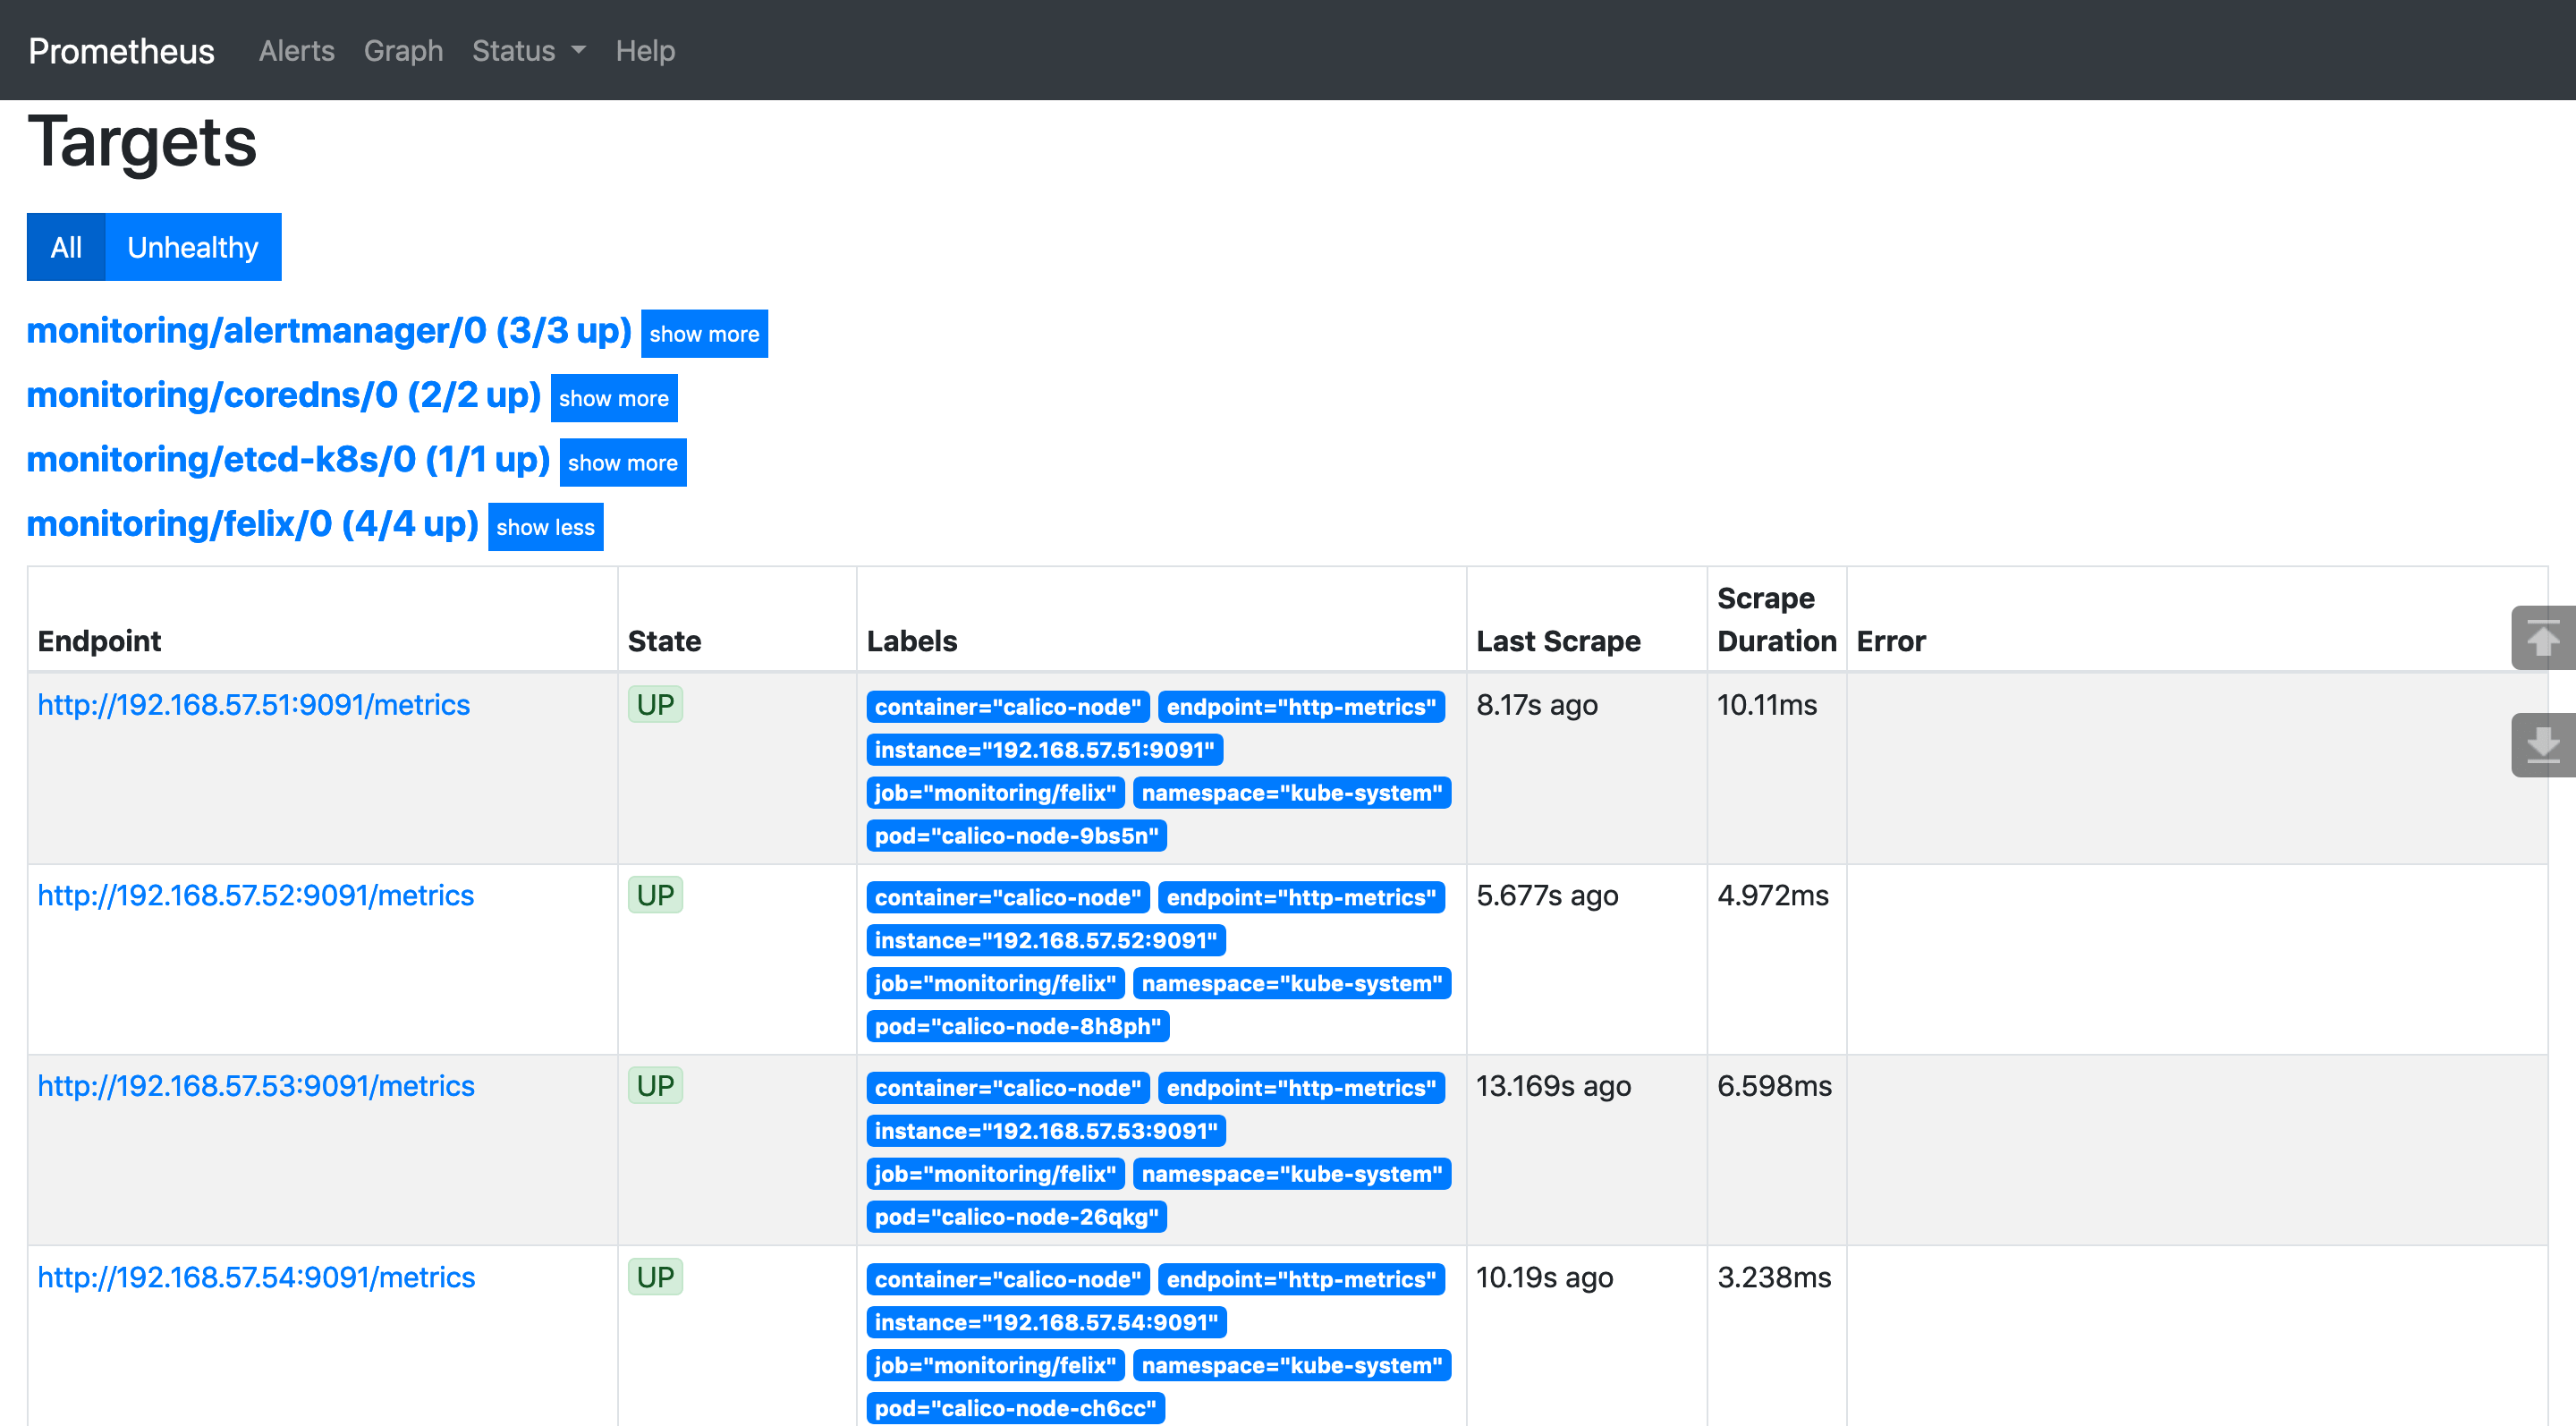
注意 Labels 中有 pod="calico-node-xxx",表明监控的是 Pod。
3. 可视化监控指标#
采集完指标之后,就可以通过 Grafana 的仪表盘来展示监控指标了。Prometheus-Operator 中部署的 Grafana 无法实时修改仪表盘的配置(必须提前将仪表盘的 json 文件挂载到 Grafana Pod 中),而且也不是最新版(7.0 以上版本),所以我选择删除 Prometheus-Operator 自带的 Grafana,自行部署 helm 仓库中的 Grafana。先进入 kube-prometheus 项目的 manifests 目录,然后将 Grafana 相关的部署清单都移到同一个目录下,再删除 Grafana:
$ cd kube-prometheus/manifests
$ mkdir grafana
$ mv grafana-* grafana/
$ kubectl delete -f grafana/
然后通过 helm 部署最新的 Grafana:
$ helm install grafana stable/grafana -n monitoring
访问 Grafana 的密码保存在 Secret 中,可以通过以下命令查看:
$ kubectl -n monitoring get secret grafana -o yaml

apiVersion: v1
data:
  admin-password: MnpoV3VaMGd1b3R3TDY5d3JwOXlIak4yZ3B2cTU1RFNKcVY0RWZsUw==
  admin-user: YWRtaW4=
  ldap-toml: ""
kind: Secret
metadata:
...
对密码进行解密:
$ echo -n "MnpoV3VaMGd1b3R3TDY5d3JwOXlIak4yZ3B2cTU1RFNKcVY0RWZsUw=="|base64 -d
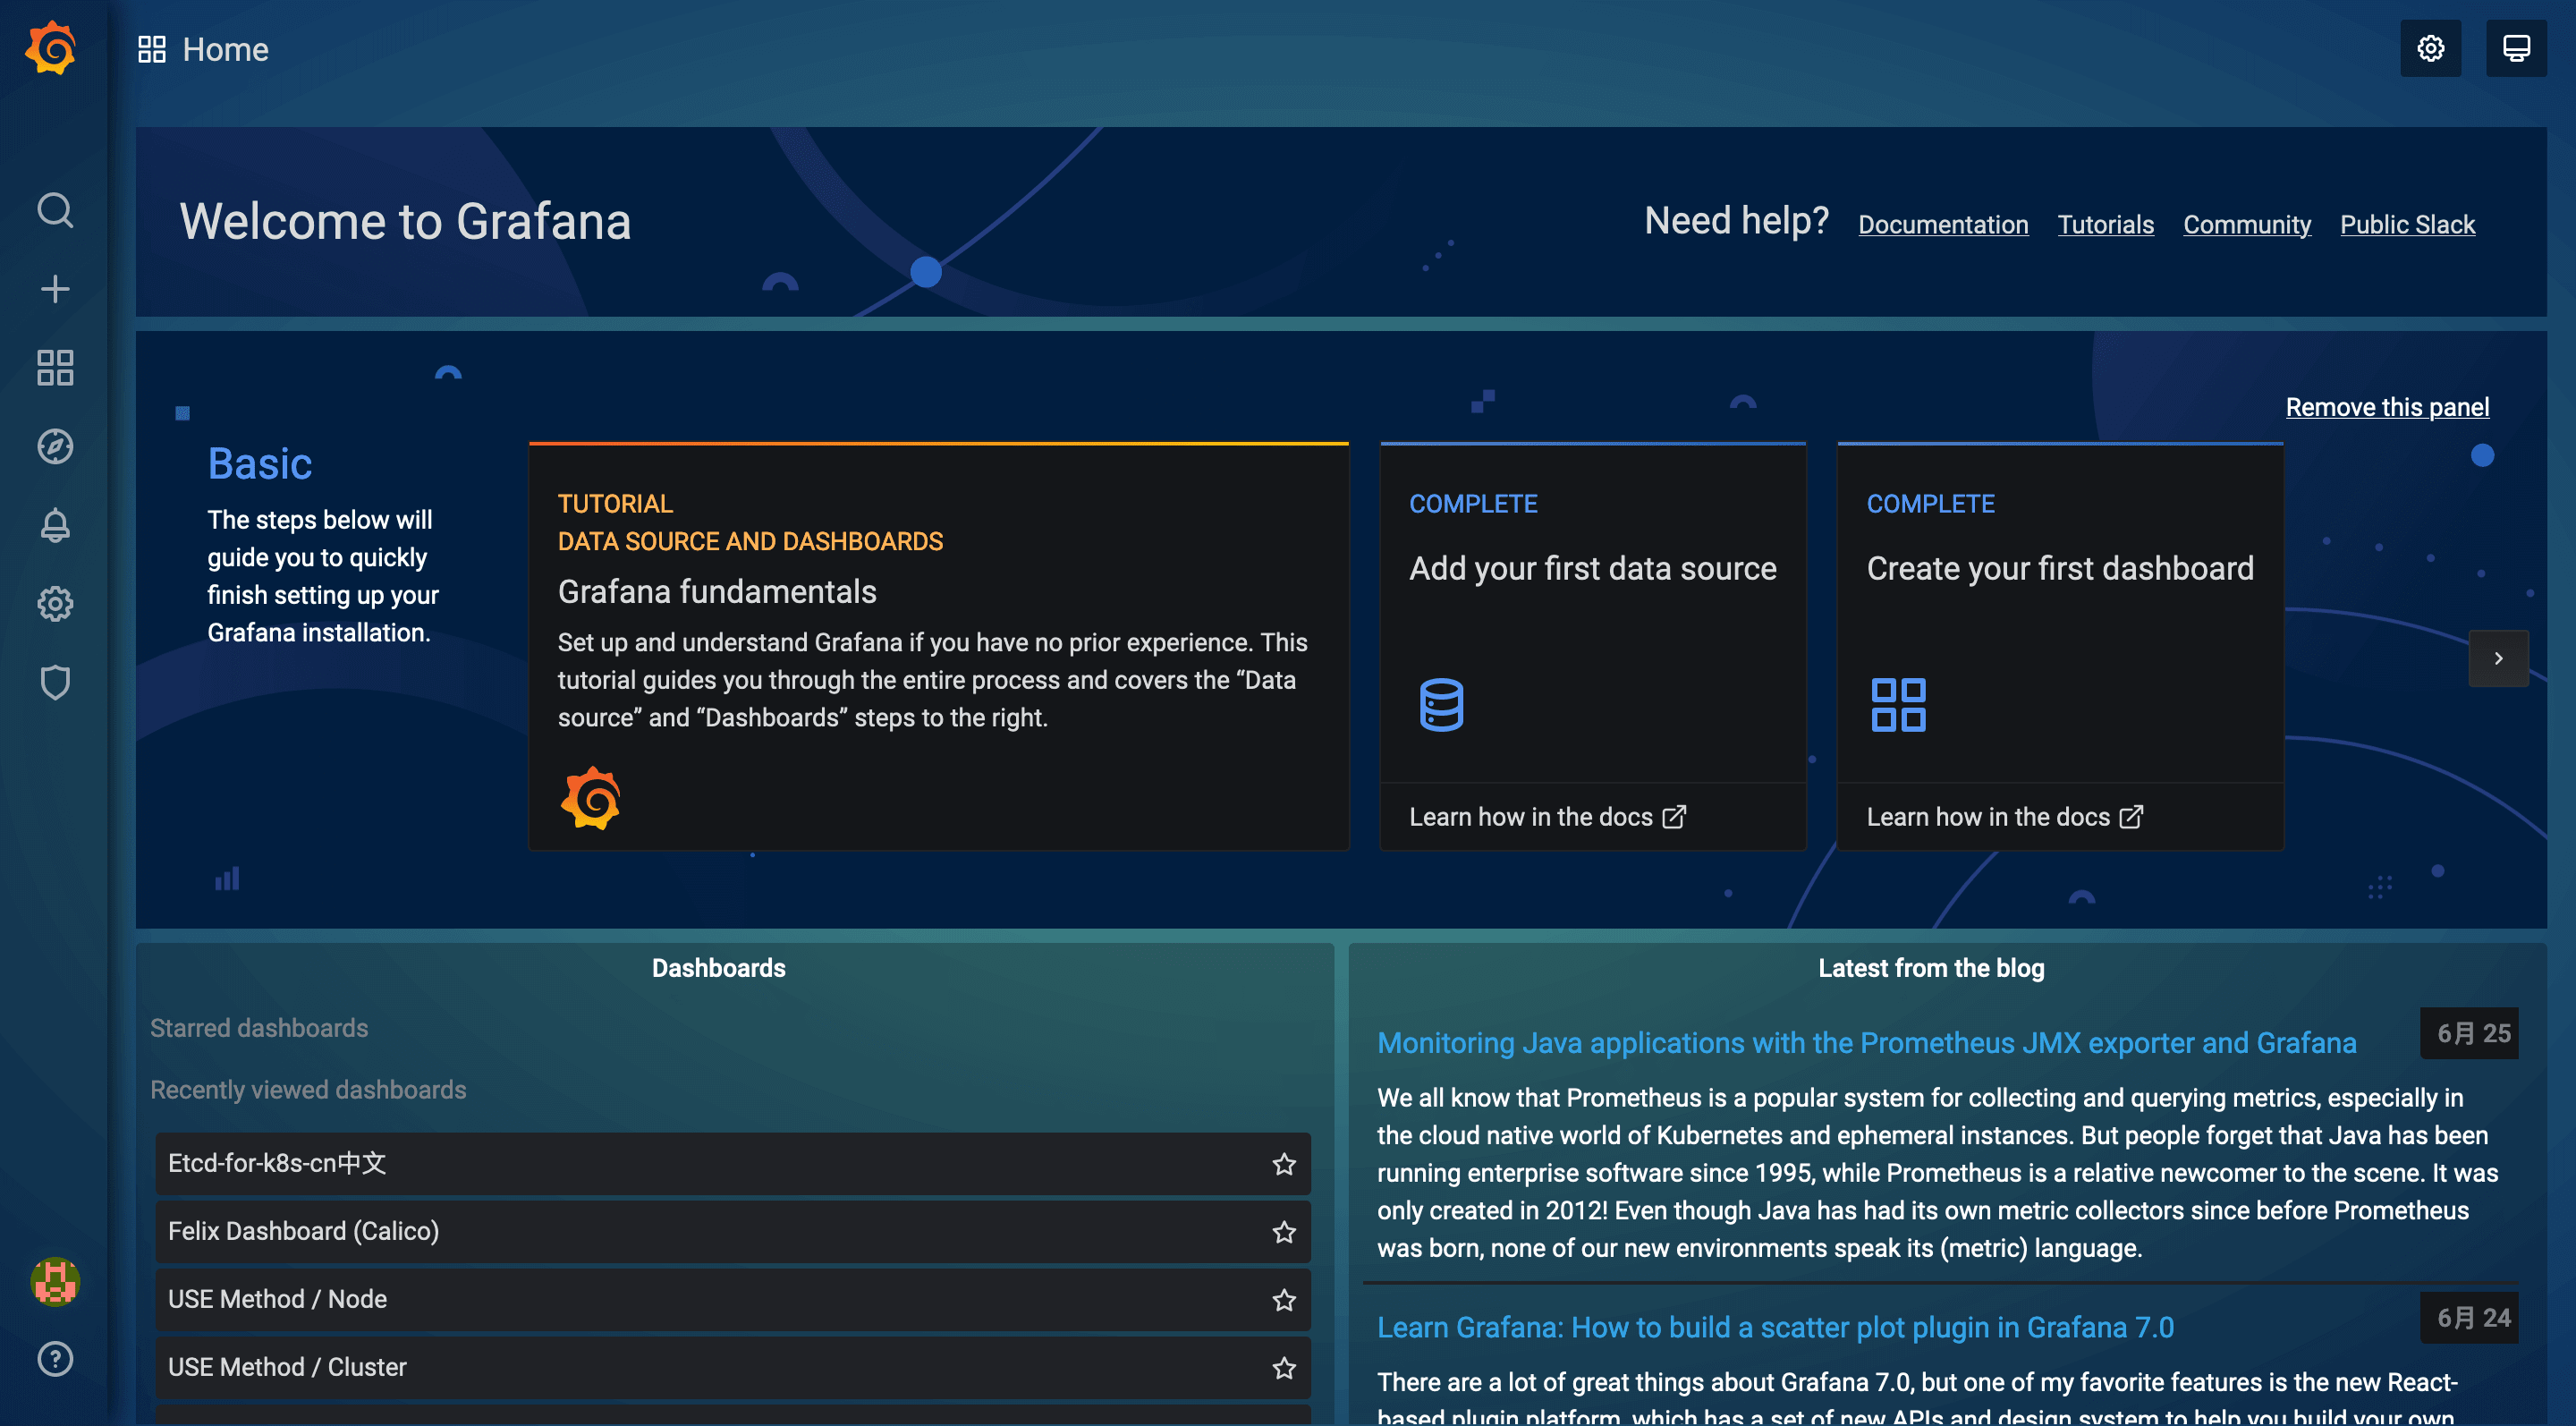
解密出来的信息就是访问密码。用户名是 admin。通过用户名和密码登录 Grafana 的 UI:
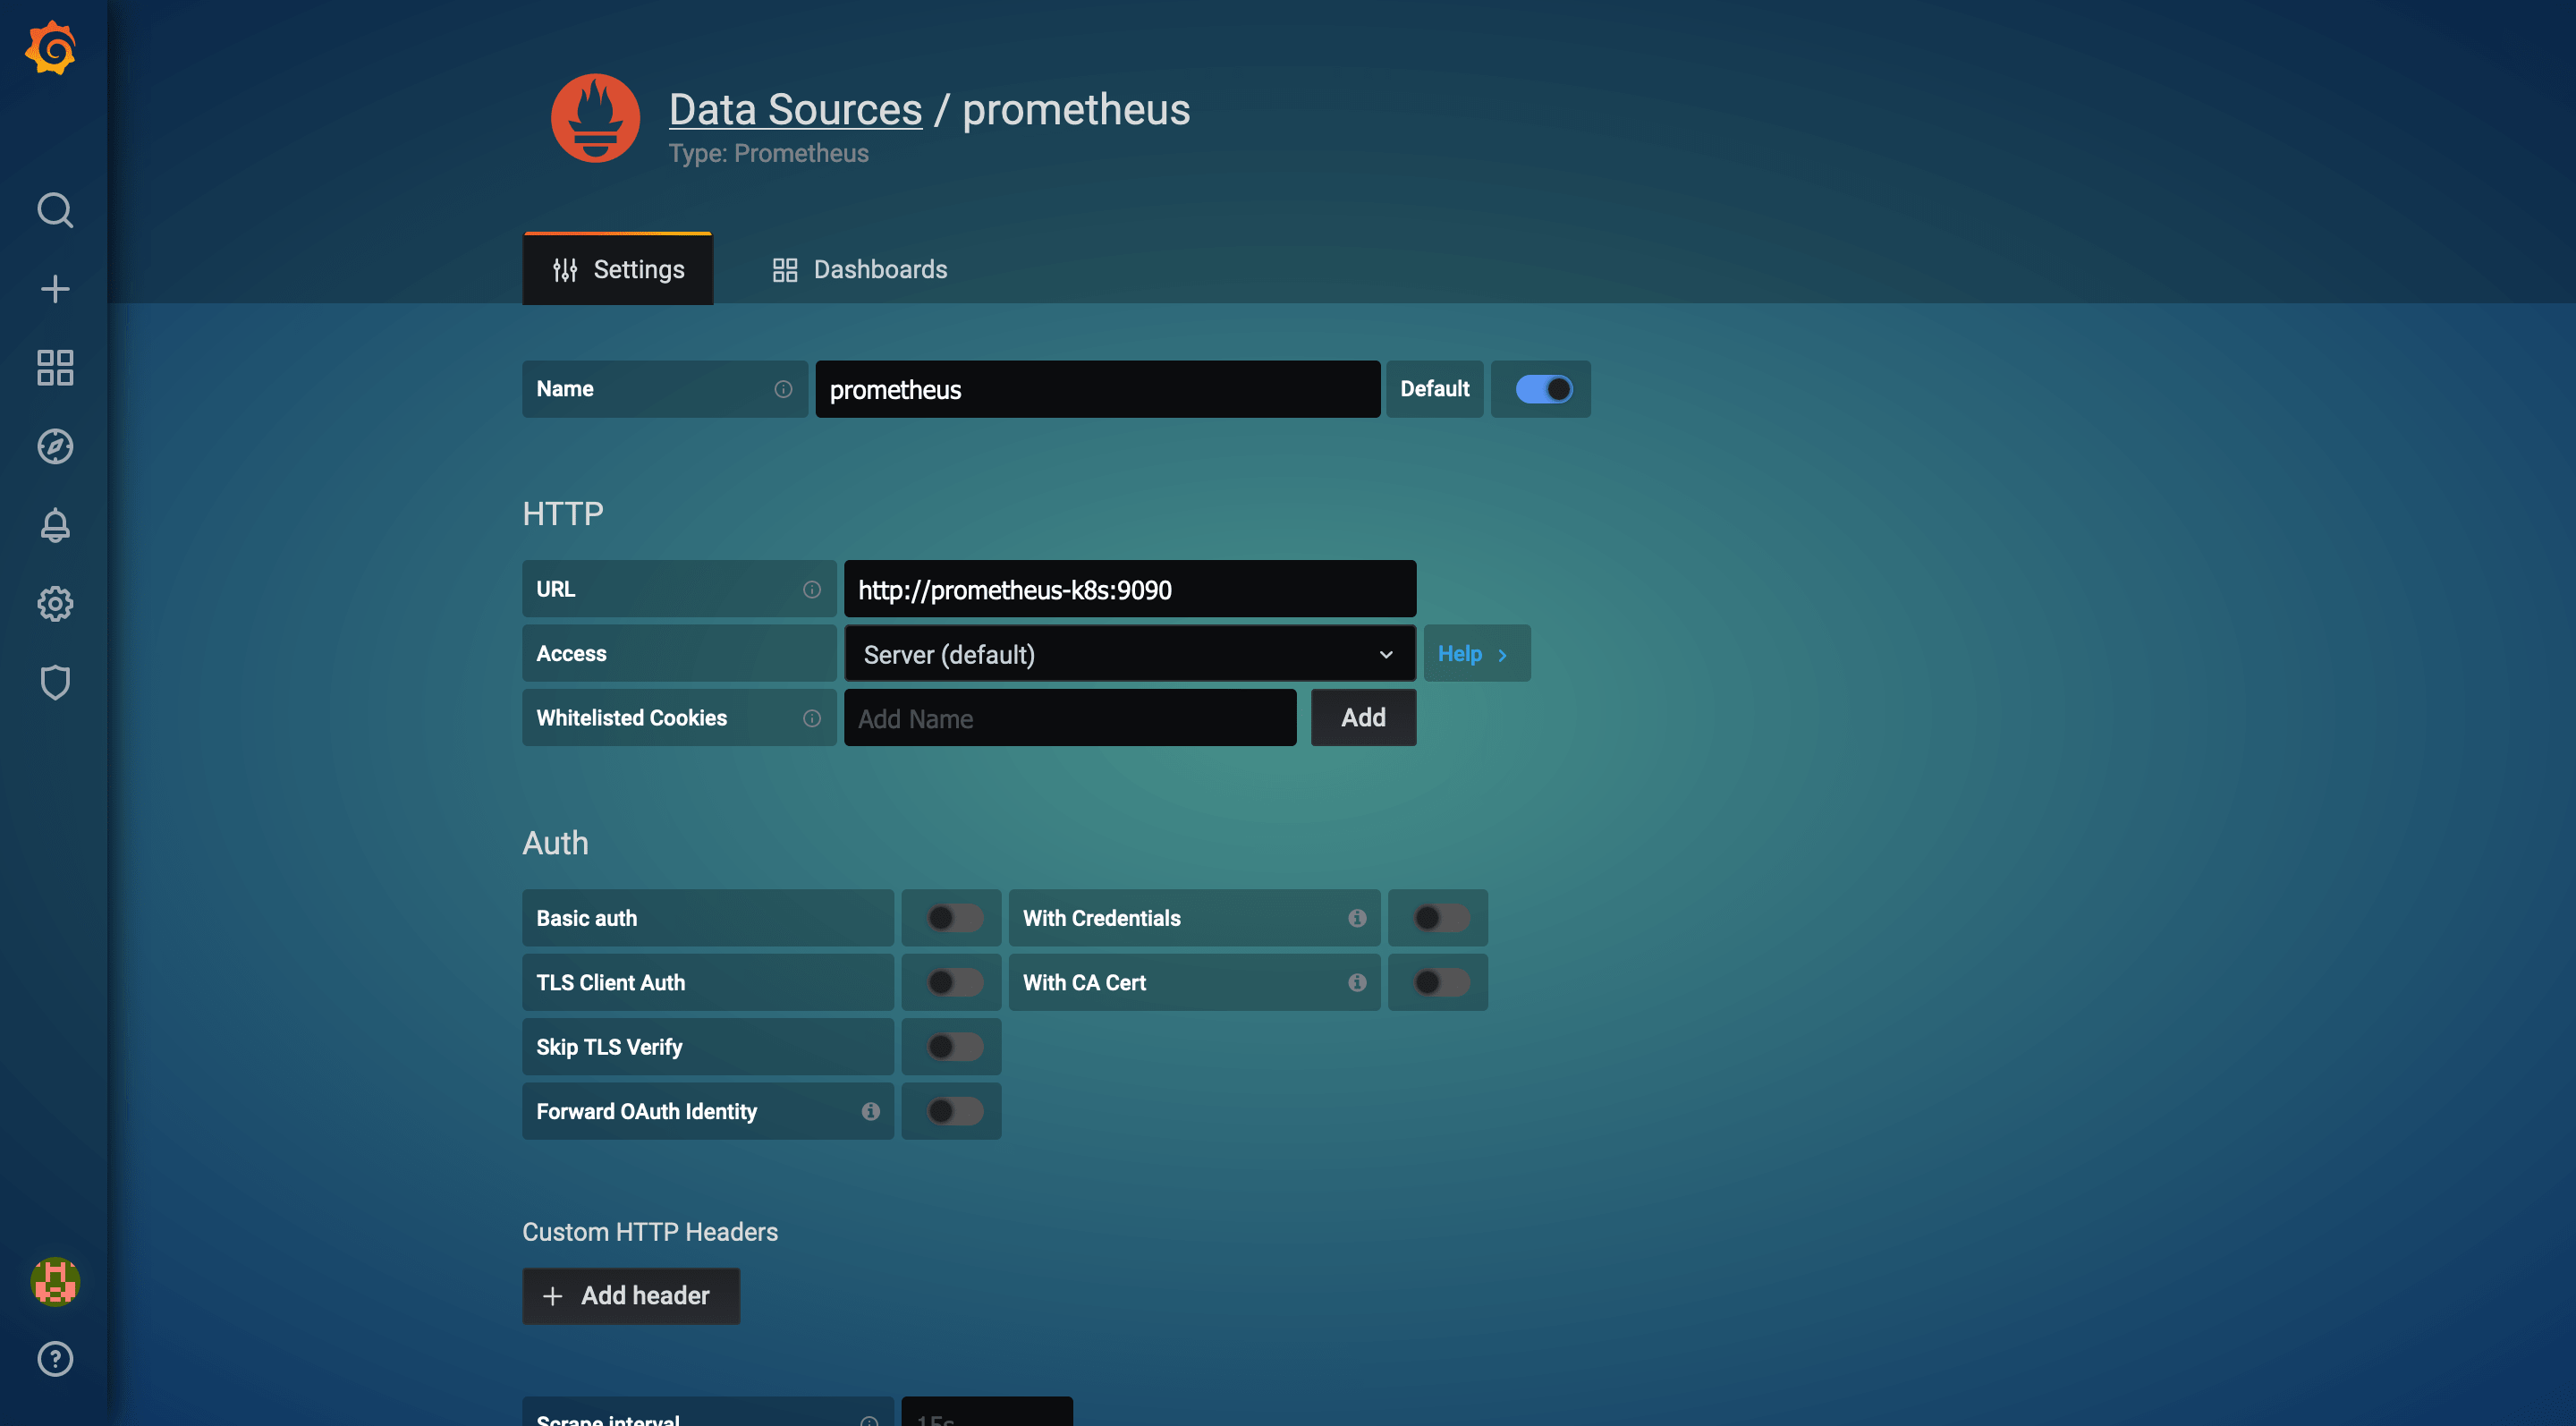
添加 Prometheus-Operator 的数据源:
Calico 官方没有单独 dashboard json,而是将其放到了
ConfigMap 中,我们需要从中提取需要的 json,提取出 felix-dashboard.json 的内容,然后将其中的 datasource 值替换为 prometheus。你可以用 sed 替换,也可以用编辑器,大多数编辑器都有全局替换的功能。如果你实在不知道如何提取,可以使用我提取好的 json:
felix-dashboard.json
{
"annotations":{
"list":[
{
"builtIn":1,
"datasource":"-- Grafana --",
"enable":true,
"hide":true,
"iconColor":"rgba(0, 211, 255, 1)",
"name":"Annotations & Alerts",
"type":"dashboard"
}]
},
"description":"Felix dashboard is part of calico documentation website, you will have great insight about you Calico instance by using this dashboard.",
"editable":true,
"gnetId":12175,
"graphTooltip":0,
"id":1,
"links":[
{
"icon":"external link",
"includeVars":false,
"tags":[
],
"targetBlank":true,
"title":"Calico documentation",
"tooltip":"Comprehensive tutorial on how to use this dashboard.",
"type":"link",
"url":"https://docs.projectcalico.org/master/maintenance/monitor/monitor-component-visual"
}],
"panels":[
{
"collapsed":false,
"datasource":"prometheus",
"gridPos":{
"h":1,
"w":24,
"x":0,
"y":0
},
"id":6,
"panels":[
],
"title":"Alerts and general info",
"type":"row"
},
{
"cacheTimeout":null,
"datasource":"prometheus",
"description":"These metrics are part of general information related to your Calico implementation.",
"gridPos":{
"h":4,
"w":8,
"x":0,
"y":1
},
"id":2,
"links":[
],
"options":{
"fieldOptions":{
"calcs":[
"lastNotNull"],
"defaults":{
"mappings":[
],
"thresholds":{
"mode":"absolute",
"steps":[
{
"color":"green",
"value":null
},
{
"color":"red",
"value":80
}]
}
},
"overrides":[
],
"values":false
},
"orientation":"auto",
"showThresholdLabels":false,
"showThresholdMarkers":true
},
"pluginVersion":"6.7.3",
"targets":[
{
"expr":"felix_active_local_endpoints",
"interval":"",
"legendFormat":"{{instance}}",
"refId":"A"
}],
"timeFrom":null,
"timeShift":null,
"title":"Active hosts on each node",
"transparent":true,
"type":"gauge"
},
{
"cacheTimeout":null,
"colorBackground":false,
"colorValue":true,
"colors":[
"#299c46",
"rgba(237, 129, 40, 0.89)",
"#d44a3a"],
"datasource":"prometheus",
"format":"none",
"gauge":{
"maxValue":100,
"minValue":0,
"show":false,
"thresholdLabels":false,
"thresholdMarkers":true
},
"gridPos":{
"h":4,
"w":3,
"x":8,
"y":1
},
"id":25,
"interval":null,
"links":[
],
"mappingType":1,
"mappingTypes":[
{
"name":"value to text",
"value":1
},
{
"name":"range to text",
"value":2
}],
"maxDataPoints":100,
"nullPointMode":"connected",
"nullText":null,
"pluginVersion":"6.7.3",
"postfix":"",
"postfixFontSize":"200%",
"prefix":"",
"prefixFontSize":"200%",
"rangeMaps":[
{
"from":"null",
"text":"N/A",
"to":"null"
}],
"sparkline":{
"fillColor":"rgba(31, 118, 189, 0.18)",
"full":false,
"lineColor":"rgb(31, 120, 193)",
"show":false,
"ymax":null,
"ymin":null
},
"tableColumn":"",
"targets":[
{
"expr":"sum(rate(felix_iptables_save_errors[5m]))",
"interval":"",
"legendFormat":"{{instance}}",
"refId":"A"
}],
"thresholds":"",
"timeFrom":null,
"timeShift":null,
"title":"iptables save errors",
"transparent":true,
"type":"singlestat",
"valueFontSize":"200%",
"valueMaps":[
{
"op":"=",
"text":"N/A",
"value":"null"
}],
"valueName":"current"
},
{
"cacheTimeout":null,
"colorBackground":false,
"colorValue":true,
"colors":[
"#299c46",
"rgba(237, 129, 40, 0.89)",
"#d44a3a"],
"datasource":"prometheus",
"format":"none",
"gauge":{
"maxValue":100,
"minValue":0,
"show":false,
"thresholdLabels":false,
"thresholdMarkers":true
},
"gridPos":{
"h":4,
"w":3,
"x":11,
"y":1
},
"id":23,
"interval":null,
"links":[
],
"mappingType":1,
"mappingTypes":[
{
"name":"value to text",
"value":1
},
{
"name":"range to text",
"value":2
}],
"maxDataPoints":100,
"nullPointMode":"connected",
"nullText":null,
"pluginVersion":"6.7.3",
"postfix":"",
"postfixFontSize":"200%",
"prefix":"",
"prefixFontSize":"200%",
"rangeMaps":[
{
"from":"null",
"text":"N/A",
"to":"null"
}],
"sparkline":{
"fillColor":"rgba(31, 118, 189, 0.18)",
"full":false,
"lineColor":"rgb(31, 120, 193)",
"show":false,
"ymax":null,
"ymin":null
},
"tableColumn":"",
"targets":[
{
"expr":"sum(rate(felix_ipset_errors[5m]))",
"interval":"",
"legendFormat":"",
"refId":"A"
}],
"thresholds":"",
"timeFrom":null,
"timeShift":null,
"title":"ipset errors",
"transparent":true,
"type":"singlestat",
"valueFontSize":"200%",
"valueMaps":[
{
"op":"=",
"text":"N/A",
"value":"null"
}],
"valueName":"current"
},
{
"cacheTimeout":null,
"colorBackground":false,
"colorValue":true,
"colors":[
"#299c46",
"rgba(237, 129, 40, 0.89)",
"#d44a3a"],
"datasource":"prometheus",
"format":"none",
"gauge":{
"maxValue":100,
"minValue":0,
"show":false,
"thresholdLabels":false,
"thresholdMarkers":true
},
"gridPos":{
"h":4,
"w":3,
"x":14,
"y":1
},
"id":18,
"interval":null,
"links":[
],
"mappingType":1,
"mappingTypes":[
{
"name":"value to text",
"value":1
},
{
"name":"range to text",
"value":2
}],
"maxDataPoints":100,
"nullPointMode":"connected",
"nullText":null,
"pluginVersion":"6.7.3",
"postfix":"",
"postfixFontSize":"200%",
"prefix":"",
"prefixFontSize":"200%",
"rangeMaps":[
{
"from":"null",
"text":"N/A",
"to":"null"
}],
"sparkline":{
"fillColor":"rgba(31, 118, 189, 0.18)",
"full":false,
"lineColor":"rgb(31, 120, 193)",
"show":false,
"ymax":null,
"ymin":null
},
"tableColumn":"",
"targets":[
{
"expr":"max(felix_cluster_num_hosts)",
"interval":"",
"legendFormat":"Calico node",
"refId":"A"
}],
"thresholds":"",
"timeFrom":null,
"timeShift":null,
"title":"Active calico nodes",
"transparent":true,
"type":"singlestat",
"valueFontSize":"200%",
"valueMaps":[
{
"op":"=",
"text":"N/A",
"value":"null"
}],
"valueName":"current"
},
{
"aliasColors":{
},
"bars":false,
"dashLength":10,
"dashes":false,
"datasource":"prometheus",
"description":"This graph shows you all the errors that Calico encounters, it is important to note occasional errors are acceptable. However, rise in the number of error or constant error counters means Calico is not working properly.",
"fill":1,
"fillGradient":0,
"gridPos":{
"h":4,
"w":7,
"x":17,
"y":1
},
"hiddenSeries":false,
"id":28,
"legend":{
"avg":false,
"current":false,
"hideEmpty":false,
"max":false,
"min":false,
"show":false,
"total":false,
"values":false
},
"lines":true,
"linewidth":1,
"links":[
],
"nullPointMode":"null as zero",
"options":{
"dataLinks":[
]
},
"percentage":false,
"pluginVersion":"6.7.2",
"pointradius":2,
"points":false,
"renderer":"flot",
"seriesOverrides":[
],
"spaceLength":10,
"stack":false,
"steppedLine":false,
"targets":[
{
"expr":"rate(felix_ipset_errors[5m])",
"interval":"",
"legendFormat":"{{instance}} ipset errors",
"refId":"A"
},
{
"expr":"rate(felix_iptables_restore_errors[5m])",
"interval":"",
"intervalFactor":1,
"legendFormat":"{{instance}} iptables restore errors",
"refId":"B"
},
{
"expr":"rate(felix_iptables_save_errors[5m])",
"interval":"",
"legendFormat":"{{instance}} iptables save errors",
"refId":"C"
},
{
"expr":"rate(felix_log_errors[5m])",
"interval":"",
"legendFormat":"{{instance}} log errors",
"refId":"D"
}],
"thresholds":[
],
"timeFrom":null,
"timeRegions":[
],
"timeShift":null,
"title":"Errors plot",
"tooltip":{
"shared":true,
"sort":1,
"value_type":"individual"
},
"transparent":true,
"type":"graph",
"xaxis":{
"buckets":null,
"mode":"time",
"name":null,
"show":true,
"values":[
]
},
"yaxes":[
{
"format":"short",
"label":null,
"logBase":1,
"max":null,
"min":null,
"show":true
},
{
"format":"short",
"label":null,
"logBase":1,
"max":null,
"min":null,
"show":true
}],
"yaxis":{
"align":false,
"alignLevel":null
}
},
{
"datasource":"prometheus",
"description":"More policies on Felix means more effort required by Calico to manage packets. ",
"gridPos":{
"h":4,
"w":8,
"x":0,
"y":5
},
"id":20,
"options":{
"fieldOptions":{
"calcs":[
"mean"],
"defaults":{
"mappings":[
],
"thresholds":{
"mode":"absolute",
"steps":[
{
"color":"green",
"value":null
},
{
"color":"red",
"value":80
}]
}
},
"overrides":[
],
"values":false
},
"orientation":"auto",
"showThresholdLabels":false,
"showThresholdMarkers":true
},
"pluginVersion":"6.7.3",
"targets":[
{
"expr":"felix_cluster_num_policies",
"interval":"",
"legendFormat":"{{instance}}",
"refId":"A"
}],
"timeFrom":null,
"timeShift":null,
"title":"Felix cluster policies",
"transparent":true,
"type":"gauge"
},
{
"cacheTimeout":null,
"colorBackground":false,
"colorValue":true,
"colors":[
"#299c46",
"rgba(237, 129, 40, 0.89)",
"#d44a3a"],
"datasource":"prometheus",
"format":"none",
"gauge":{
"maxValue":100,
"minValue":0,
"show":false,
"thresholdLabels":false,
"thresholdMarkers":true
},
"gridPos":{
"h":4,
"w":3,
"x":8,
"y":5
},
"id":29,
"interval":null,
"links":[
],
"mappingType":1,
"mappingTypes":[
{
"name":"value to text",
"value":1
},
{
"name":"range to text",
"value":2
}],
"maxDataPoints":100,
"nullPointMode":"connected",
"nullText":null,
"pluginVersion":"6.7.3",
"postfix":"",
"postfixFontSize":"200%",
"prefix":"",
"prefixFontSize":"200%",
"rangeMaps":[
{
"from":"null",
"text":"N/A",
"to":"null"
}],
"sparkline":{
"fillColor":"rgba(31, 118, 189, 0.18)",
"full":false,
"lineColor":"rgb(31, 120, 193)",
"show":false,
"ymax":null,
"ymin":null
},
"tableColumn":"",
"targets":[
{
"expr":"sum(rate(felix_iptables_restore_errors[5m]))",
"interval":"",
"legendFormat":"",
"refId":"A"
}],
"thresholds":"",
"timeFrom":null,
"timeShift":null,
"title":"iptables restore errors",
"transparent":true,
"type":"singlestat",
"valueFontSize":"200%",
"valueMaps":[
{
"op":"=",
"text":"N/A",
"value":"null"
}],
"valueName":"current"
},
{
"cacheTimeout":null,
"colorBackground":false,
"colorValue":true,
"colors":[
"#299c46",
"rgba(237, 129, 40, 0.89)",
"#d44a3a"],
"datasource":"prometheus",
"format":"none",
"gauge":{
"maxValue":100,
"minValue":0,
"show":false,
"thresholdLabels":false,
"thresholdMarkers":true
},
"gridPos":{
"h":4,
"w":3,
"x":11,
"y":5
},
"id":26,
"interval":null,
"links":[
],
"mappingType":1,
"mappingTypes":[
{
"name":"value to text",
"value":1
},
{
"name":"range to text",
"value":2
}],
"maxDataPoints":100,
"nullPointMode":"connected",
"nullText":null,
"pluginVersion":"6.7.3",
"postfix":"",
"postfixFontSize":"200%",
"prefix":"",
"prefixFontSize":"200%",
"rangeMaps":[
{
"from":"null",
"text":"N/A",
"to":"null"
}],
"sparkline":{
"fillColor":"rgba(31, 118, 189, 0.18)",
"full":false,
"lineColor":"rgb(31, 120, 193)",
"show":false,
"ymax":null,
"ymin":null
},
"tableColumn":"",
"targets":[
{
"expr":"sum(rate(felix_log_errors[5m]))",
"interval":"",
"legendFormat":"{{instance}}",
"refId":"A"
}],
"thresholds":"",
"timeFrom":null,
"timeShift":null,
"title":"Felix log errors",
"transparent":true,
"type":"singlestat",
"valueFontSize":"200%",
"valueMaps":[
{
"op":"=",
"text":"N/A",
"value":"null"
}],
"valueName":"current"
},
{
"cacheTimeout":null,
"colorBackground":false,
"colorValue":true,
"colors":[
"#299c46",
"rgba(237, 129, 40, 0.89)",
"#d44a3a"],
"datasource":"prometheus",
"format":"none",
"gauge":{
"maxValue":100,
"minValue":0,
"show":false,
"thresholdLabels":false,
"thresholdMarkers":true
},
"gridPos":{
"h":4,
"w":3,
"x":14,
"y":5
},
"id":24,
"interval":null,
"links":[
],
"mappingType":1,
"mappingTypes":[
{
"name":"value to text",
"value":1
},
{
"name":"range to text",
"value":2
}],
"maxDataPoints":100,
"nullPointMode":"connected",
"nullText":null,
"pluginVersion":"6.7.3",
"postfix":"",
"postfixFontSize":"200%",
"prefix":"",
"prefixFontSize":"200%",
"rangeMaps":[
{
"from":"null",
"text":"N/A",
"to":"null"
}],
"sparkline":{
"fillColor":"rgba(31, 118, 189, 0.18)",
"full":false,
"lineColor":"rgb(31, 120, 193)",
"show":false,
"ymax":null,
"ymin":null
},
"tableColumn":"",
"targets":[
{
"expr":"sum(rate(felix_resyncs_started[5m])) ",
"interval":"",
"legendFormat":"",
"refId":"A"
}],
"thresholds":"",
"timeFrom":null,
"timeShift":null,
"title":"Felix resync started",
"transparent":true,
"type":"singlestat",
"valueFontSize":"200%",
"valueMaps":[
{
"op":"=",
"text":"N/A",
"value":"null"
}],
"valueName":"avg"
},
{
"aliasColors":{
},
"bars":false,
"dashLength":10,
"dashes":false,
"datasource":"prometheus",
"fill":1,
"fillGradient":0,
"gridPos":{
"h":4,
"w":7,
"x":17,
"y":5
},
"hiddenSeries":false,
"id":31,
"legend":{
"avg":false,
"current":false,
"max":false,
"min":false,
"show":false,
"total":false,
"values":false
},
"lines":true,
"linewidth":1,
"nullPointMode":"null",
"options":{
"dataLinks":[
]
},
"percentage":false,
"pointradius":2,
"points":false,
"renderer":"flot",
"seriesOverrides":[
],
"spaceLength":10,
"stack":false,
"steppedLine":false,
"targets":[
{
"expr":"felix_logs_dropped",
"interval":"",
"legendFormat":"{{instance}}",
"refId":"A"
}],
"thresholds":[
],
"timeFrom":null,
"timeRegions":[
],
"timeShift":null,
"title":"Felix dropped logs",
"tooltip":{
"shared":true,
"sort":0,
"value_type":"individual"
},
"transparent":true,
"type":"graph",
"xaxis":{
"buckets":null,
"mode":"time",
"name":null,
"show":true,
"values":[
]
},
"yaxes":[
{
"format":"short",
"label":null,
"logBase":1,
"max":null,
"min":null,
"show":true
},
{
"format":"short",
"label":null,
"logBase":1,
"max":null,
"min":null,
"show":true
}],
"yaxis":{
"align":false,
"alignLevel":null
}
},
{
"collapsed":false,
"datasource":"prometheus",
"gridPos":{
"h":1,
"w":24,
"x":0,
"y":9
},
"id":14,
"panels":[
],
"title":"Dataplane",
"type":"row"
},
{
"aliasColors":{
},
"bars":false,
"dashLength":10,
"dashes":false,
"datasource":"prometheus",
"description":"Dataplane apply time can indicate how busy your Kubernetes instance is. This can slow down Calico performance",
"fill":2,
"fillGradient":4,
"gridPos":{
"h":7,
"w":8,
"x":0,
"y":10
},
"hiddenSeries":false,
"id":16,
"legend":{
"avg":false,
"current":false,
"max":false,
"min":false,
"show":true,
"total":false,
"values":false
},
"lines":true,
"linewidth":2,
"nullPointMode":"null",
"options":{
"dataLinks":[
]
},
"percentage":false,
"pointradius":2,
"points":false,
"renderer":"flot",
"seriesOverrides":[
],
"spaceLength":10,
"stack":false,
"steppedLine":false,
"targets":[
{
"expr":"felix_int_dataplane_apply_time_seconds{quantile=\"0.5\"}",
"format":"time_series",
"instant":false,
"interval":"",
"intervalFactor":1,
"legendFormat":"{{instance}}",
"refId":"A"
}],
"thresholds":[
],
"timeFrom":null,
"timeRegions":[
],
"timeShift":null,
"title":"Dataplane apply time quantile 0.5",
"tooltip":{
"shared":true,
"sort":0,
"value_type":"individual"
},
"transparent":true,
"type":"graph",
"xaxis":{
"buckets":null,
"mode":"time",
"name":null,
"show":true,
"values":[
]
},
"yaxes":[
{
"format":"short",
"label":null,
"logBase":1,
"max":null,
"min":null,
"show":true
},
{
"format":"short",
"label":null,
"logBase":1,
"max":null,
"min":null,
"show":true
}],
"yaxis":{
"align":false,
"alignLevel":null
}
},
{
"aliasColors":{
},
"bars":false,
"dashLength":10,
"dashes":false,
"datasource":"prometheus",
"fill":2,
"fillGradient":4,
"gridPos":{
"h":7,
"w":8,
"x":8,
"y":10
},
"hiddenSeries":false,
"id":15,
"legend":{
"avg":false,
"current":false,
"max":false,
"min":false,
"show":true,
"total":false,
"values":false
},
"lines":true,
"linewidth":2,
"nullPointMode":"null",
"options":{
"dataLinks":[
]
},
"percentage":false,
"pointradius":2,
"points":false,
"renderer":"flot",
"seriesOverrides":[
],
"spaceLength":10,
"stack":false,
"steppedLine":false,
"targets":[
{
"expr":"felix_int_dataplane_apply_time_seconds{quantile=\"0.9\"}",
"interval":"",
"legendFormat":"{{instance}}",
"refId":"A"
}],
"thresholds":[
],
"timeFrom":null,
"timeRegions":[
],
"timeShift":null,
"title":"Dataplane apply time quantile 0.9",
"tooltip":{
"shared":true,
"sort":0,
"value_type":"individual"
},
"transparent":true,
"type":"graph",
"xaxis":{
"buckets":null,
"mode":"time",
"name":null,
"show":true,
"values":[
]
},
"yaxes":[
{
"format":"short",
"label":null,
"logBase":1,
"max":null,
"min":null,
"show":true
},
{
"format":"short",
"label":null,
"logBase":1,
"max":null,
"min":null,
"show":true
}],
"yaxis":{
"align":false,
"alignLevel":null
}
},
{
"aliasColors":{
},
"bars":false,
"dashLength":10,
"dashes":false,
"datasource":"prometheus",
"fill":2,
"fillGradient":4,
"gridPos":{
"h":7,
"w":8,
"x":16,
"y":10
},
"hiddenSeries":false,
"id":12,
"legend":{
"avg":false,
"current":false,
"max":false,
"min":false,
"show":true,
"total":false,
"values":false
},
"lines":true,
"linewidth":2,
"nullPointMode":"null",
"options":{
"dataLinks":[
]
},
"percentage":false,
"pointradius":2,
"points":false,
"renderer":"flot",
"seriesOverrides":[
],
"spaceLength":10,
"stack":false,
"steppedLine":false,
"targets":[
{
"expr":"felix_int_dataplane_apply_time_seconds{quantile=\"0.99\"}",
"interval":"",
"legendFormat":"{{instance}}",
"refId":"A"
}],
"thresholds":[
],
"timeFrom":null,
"timeRegions":[
],
"timeShift":null,
"title":"Dataplane apply time quantile 0.99",
"tooltip":{
"shared":true,
"sort":0,
"value_type":"individual"
},
"transparent":true,
"type":"graph",
"xaxis":{
"buckets":null,
"mode":"time",
"name":null,
"show":true,
"values":[
]
},
"yaxes":[
{
"format":"short",
"label":null,
"logBase":1,
"max":null,
"min":null,
"show":true
},
{
"format":"short",
"label":null,
"logBase":1,
"max":null,
"min":null,
"show":true
}],
"yaxis":{
"align":false,
"alignLevel":null
}
},
{
"collapsed":false,
"datasource":null,
"gridPos":{
"h":1,
"w":24,
"x":0,
"y":17
},
"id":35,
"panels":[
],
"title":"Route table",
"type":"row"
},
{
"aliasColors":{
},
"bars":false,
"dashLength":10,
"dashes":false,
"datasource":"prometheus",
"fill":1,
"fillGradient":0,
"gridPos":{
"h":7,
"w":8,
"x":0,
"y":18
},
"hiddenSeries":false,
"id":33,
"legend":{
"avg":false,
"current":false,
"max":false,
"min":false,
"show":false,
"total":false,
"values":false
},
"lines":true,
"linewidth":1,
"nullPointMode":"null",
"options":{
"dataLinks":[
]
},
"percentage":false,
"pointradius":2,
"points":false,
"renderer":"flot",
"seriesOverrides":[
],
"spaceLength":10,
"stack":false,
"steppedLine":false,
"targets":[
{
"expr":"felix_route_table_list_seconds{quantile=\"0.5\"}",
"interval":"",
"legendFormat":"{{instance}}",
"refId":"A"
}],
"thresholds":[
],
"timeFrom":null,
"timeRegions":[
],
"timeShift":null,
"title":"Felix route table list seconds quantile 0.5",
"tooltip":{
"shared":true,
"sort":0,
"value_type":"individual"
},
"transparent":true,
"type":"graph",
"xaxis":{
"buckets":null,
"mode":"time",
"name":null,
"show":true,
"values":[
]
},
"yaxes":[
{
"format":"short",
"label":null,
"logBase":1,
"max":null,
"min":null,
"show":true
},
{
"format":"short",
"label":null,
"logBase":1,
"max":null,
"min":null,
"show":true
}],
"yaxis":{
"align":false,
"alignLevel":null
}
},
{
"aliasColors":{
},
"bars":false,
"dashLength":10,
"dashes":false,
"datasource":"prometheus",
"fill":1,
"fillGradient":0,
"gridPos":{
"h":7,
"w":8,
"x":8,
"y":18
},
"hiddenSeries":false,
"id":36,
"legend":{
"avg":false,
"current":false,
"max":false,
"min":false,
"show":false,
"total":false,
"values":false
},
"lines":true,
"linewidth":1,
"nullPointMode":"null",
"options":{
"dataLinks":[
]
},
"percentage":false,
"pointradius":2,
"points":false,
"renderer":"flot",
"seriesOverrides":[
],
"spaceLength":10,
"stack":false,
"steppedLine":false,
"targets":[
{
"expr":"felix_route_table_list_seconds{quantile=\"0.9\"}",
"interval":"",
"legendFormat":"{{instance}}",
"refId":"A"
}],
"thresholds":[
],
"timeFrom":null,
"timeRegions":[
],
"timeShift":null,
"title":"Felix route table list seconds quantile 0.9",
"tooltip":{
"shared":true,
"sort":0,
"value_type":"individual"
},
"transparent":true,
"type":"graph",
"xaxis":{
"buckets":null,
"mode":"time",
"name":null,
"show":true,
"values":[
]
},
"yaxes":[
{
"format":"short",
"label":null,
"logBase":1,
"max":null,
"min":null,
"show":true
},
{
"format":"short",
"label":null,
"logBase":1,
"max":null,
"min":null,
"show":true
}],
"yaxis":{
"align":false,
"alignLevel":null
}
},
{
"aliasColors":{
},
"bars":false,
"dashLength":10,
"dashes":false,
"datasource":"prometheus",
"fill":1,
"fillGradient":0,
"gridPos":{
"h":7,
"w":8,
"x":16,
"y":18
},
"hiddenSeries":false,
"id":37,
"legend":{
"avg":false,
"current":false,
"max":false,
"min":false,
"show":false,
"total":false,
"values":false
},
"lines":true,
"linewidth":1,
"nullPointMode":"null",
"options":{
"dataLinks":[
]
},
"percentage":false,
"pointradius":2,
"points":false,
"renderer":"flot",
"seriesOverrides":[
],
"spaceLength":10,
"stack":false,
"steppedLine":false,
"targets":[
{
"expr":"felix_route_table_list_seconds{quantile=\"0.99\"}",
"interval":"",
"legendFormat":"{{instance}}",
"refId":"A"
}],
"thresholds":[
],
"timeFrom":null,
"timeRegions":[
],
"timeShift":null,
"title":"Felix route table list seconds quantile 0.99",
"tooltip":{
"shared":true,
"sort":0,
"value_type":"individual"
},
"transparent":true,
"type":"graph",
"xaxis":{
"buckets":null,
"mode":"time",
"name":null,
"show":true,
"values":[
]
},
"yaxes":[
{
"format":"short",
"label":null,
"logBase":1,
"max":null,
"min":null,
"show":true
},
{
"format":"short",
"label":null,
"logBase":1,
"max":null,
"min":null,
"show":true
}],
"yaxis":{
"align":false,
"alignLevel":null
}
}],
"refresh":false,
"schemaVersion":22,
"style":"dark",
"tags":[
"calico",
"felix",
"kubernetes",
"k8s",
"calico-node",
"cloud",
"cluster monitoring",
"policy monitoring"],
"templating":{
"list":[
]
},
"time":{
"from":"now-6h",
"to":"now"
},
"timepicker":{
"refresh_intervals":[
"5s",
"10s",
"30s",
"1m",
"5m",
"15m",
"30m",
"1h",
"2h",
"1d"]
},
"timezone":"",
"title":"Felix Dashboard (Calico)",
"uid":"calico-felix-dashboard",
"variables":{
"list":[
]
},
"version":1
}
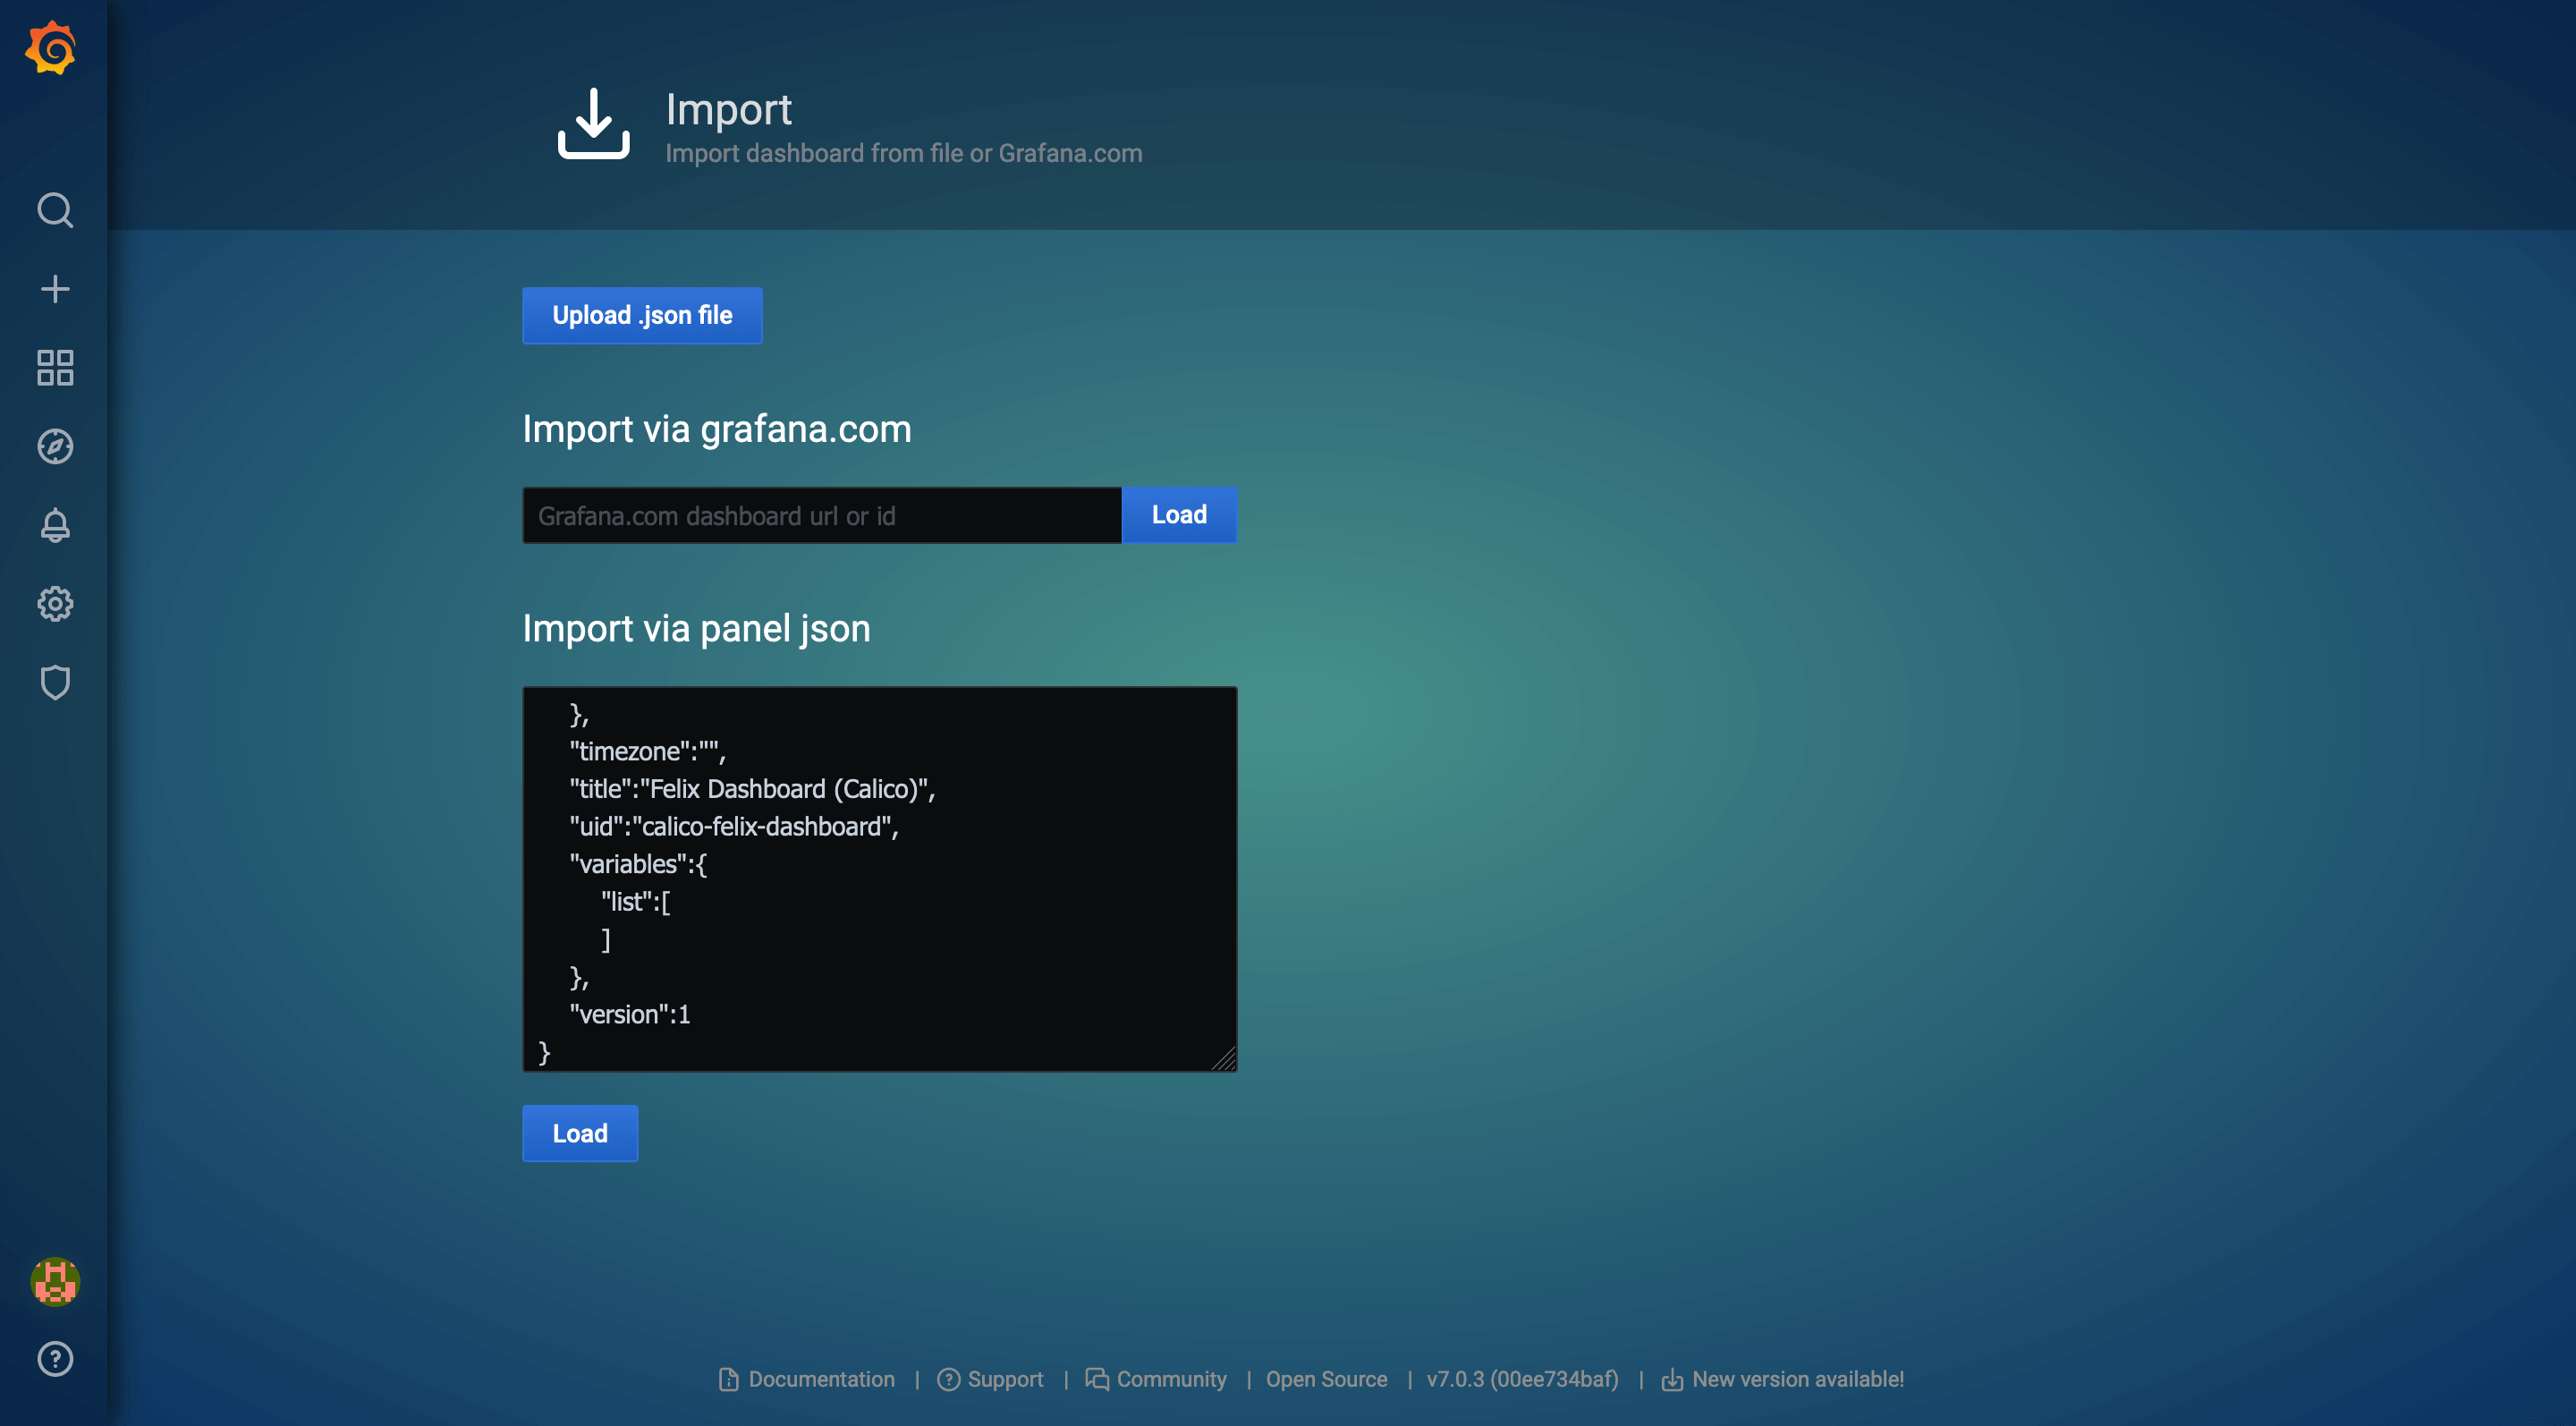
修改完了之后,将 json 内容导入到 Grafana:
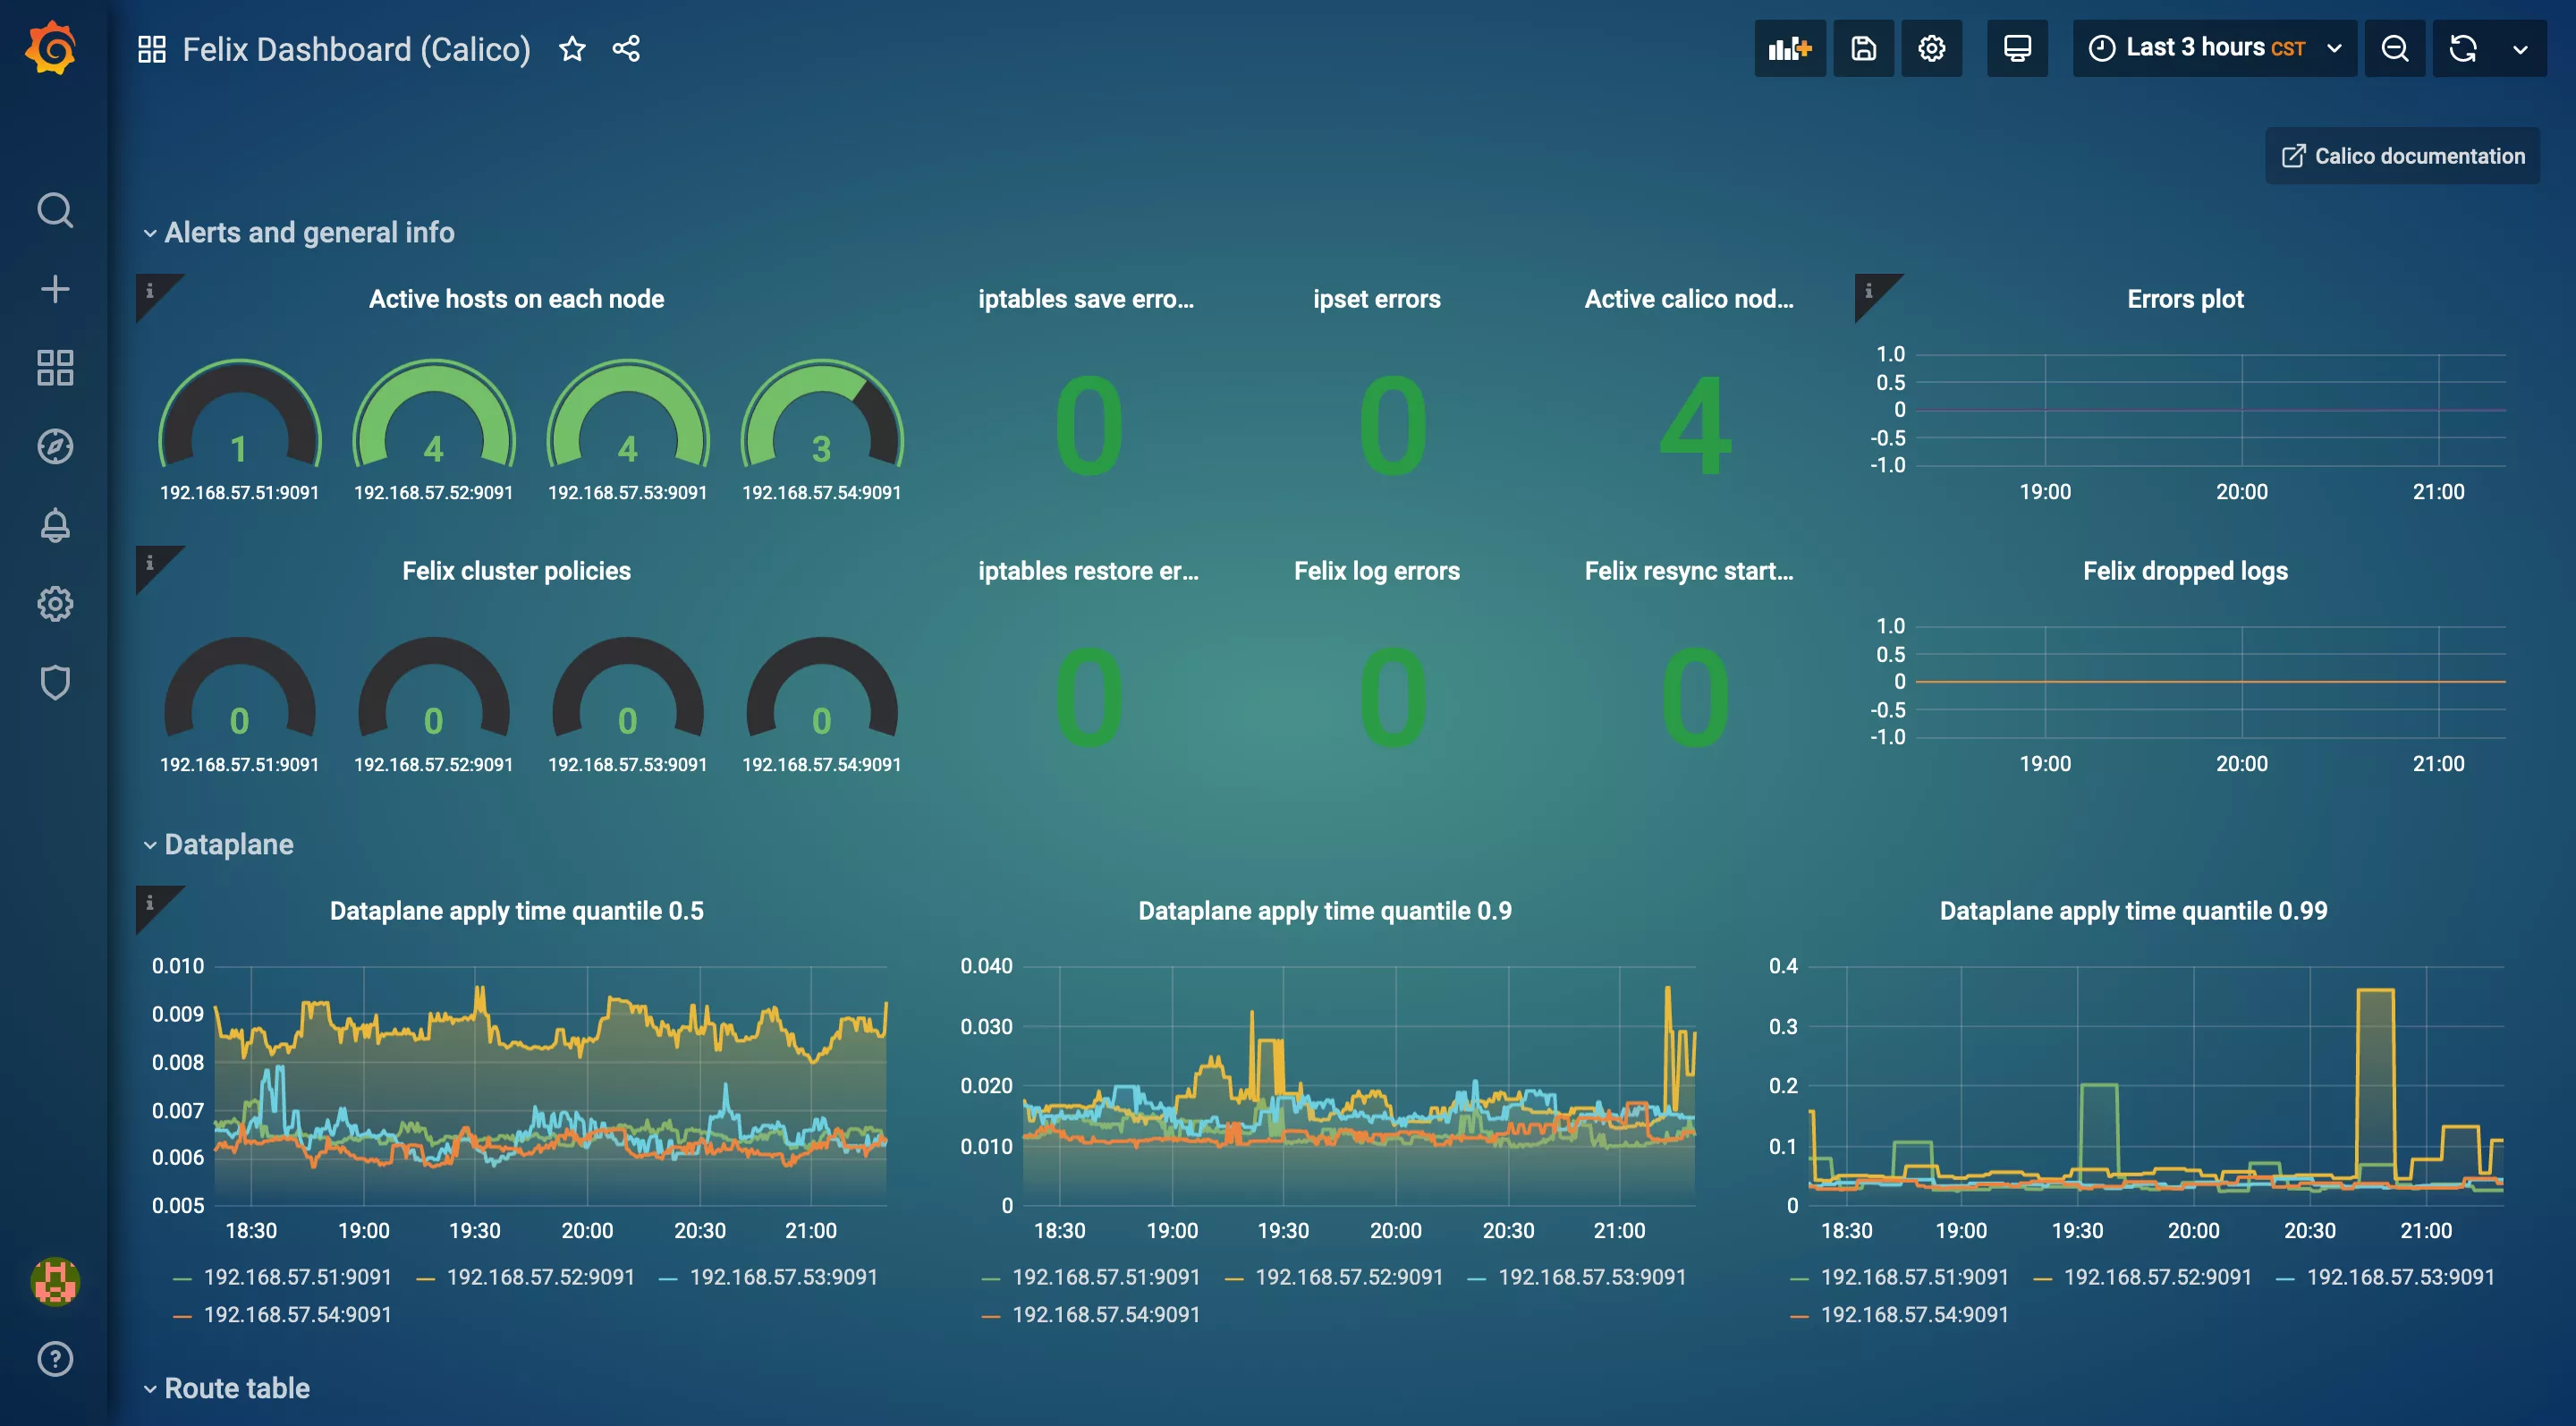
最后得到的 Felix 仪表盘如下图所示:
如果你对我截图中 Grafana 的主题配色很感兴趣,可以参考这篇文章: Grafana 自定义主题。


